


9/13/2012 9:38:44 AM
Finally...
Today is huge - and maybe even tomorrow as institutions may take some time to digest the data from the fed. With markets extended, bonds and dollar down, stocks at highs, and given the seasonality, and the rapid rise in bullish sentiment, I could easily make a case for the markets moving lower here. But price action and the barometer still need to confirm it. And we're not there yet.
If bonds break lower, then we have a liquidity move which will propell markets higher. No indicator that I've developed can measure this liquidity move other than prices remaining above the 9dma for an extended period. If you know of one, let me know - I'll analyze it and put it in our data base and incorporate it into the barometer.
But the dollar is SO extended lower - if it starts to rally, it has the potential to derail stock prices.
So today's action is key. We'll be watching and advise intra day if we decide to make a call. If the selling is too strong, it could set up a bounce on Friday. So we'll be cautious.
If you want to participate in our Social Media experience, please visit and "LIKE" our FaceBook page. I'll have periodic updates on there and I WANT your feedback. This will be a good way to share your views with other traders.
http://www.facebook.com/InvestmentResearchGroupInc
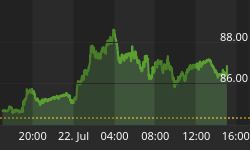
Here's a look at the global stock markets:

On the economic front, here is the schedule for this week. Pay close attention to the timing of the report and the potential for the markets to make short term reversals at those points.

On to the charts:

Stock Barometer Analysis
The Barometer has ticked up, giving us a Buy Signal. But we remain short term cautious - as the barometer could roll over here and give a lower level sell signal. I'll email intra day if we take a position. Remain in cash.
Whatever move comes next, should continue into the end of the month - around 9/25.
The Stock Barometer is my proprietary market timing system. The direction, slope and level of the Stock Barometer determine our outlook. For example, if the barometer line is moving down, we are in Sell Mode. A Buy or Sell Signal is triggered when the indicator clearly changes direction. Trend and support can override the barometer signals.
Money Management & Stops
To trade this system, there are a few things you need to know and address to control your risk:
• This system targets intermediate term moves, of which even in the best years, there are usually only up to 7 profitable intermediate term moves. The rest of the year will be consolidating moves where this system will experience small losses and gains that offset each other.
• This system will usually result in losing trades more than 50% of the time, even in our best years. The key is being positioned properly for longer term moves when they come.
• Therefore it is vitally important that you apply some form of money management to protect your capital.
• Trading a leveraged index fund will result in more risk, since you cannot set stops and you cannot get out intraday.
Accordingly;
• Make sure you set your stops so that you can lose no more than 2% per trade (based on the QQQQ if you're trading leveraged funds and options with our trading service).
Potential Cycle Reversal Dates
2012 Potential Reversal Dates: 1/12, 1/27, 2/16, 2/23, 3/16, 4/9, 4/25, 5/26. 6/2, 6/15, 7/2, 7/25, 8/13, 8/30, 9/8, 9/25. These dates have an accuracy of +/- 2 days. We publish dates up to 2 months in advance.
It looks as though we're breaking out close enough to our 9/8 date and that would lead to a larger move higher into 9/25. Again, cautious here until we get a decision from the fed.
Our IRG Market Timing and Sentiment data service shows the performance of these forecast turn dates going back to 2003 and for the remainder of 2012.
My Additional timing work is based on numerous cycles and has resulted in the above potential reversal dates. These are not to be confused with the barometer signals or cycle times. However, due to their past accuracy I post the dates here.
Timing Indicators
Use the following Timing/momentum indicators to assist in your trading of the QQQQ, GLD, USD, USO and TLT. They are tuned to deliver signals in line with the Stock Barometer and we use them only in determining our overall outlook for the market and for pinpointing market reversals. The level, direction, and position to the zero line are keys in these indicators. For example, direction determines mode and a buy signal 'above zero' is more bullish than a buy signal 'below zero'.
QQQ Timing Indicator (NASDAQ:QQQ)

The QQQQ Spread Indicator will yield its own buy and sell signals that may be different from the Stock Barometer. It's meant to give us an idea of the next turn in the market.
Gold Timing Indicator (ARCX:GLD)

Want to trade Gold? Use our signals with the Gold ETF AMEX:GLD. Gold gives us a general gage to the overall health of the US Economy and the markets.
US Dollar Index Timing Indicator (INDEX:DXY)

Want to trade the US Dollar? Use our signals with the Power Shares AMEX:UUP: US Dollar Index Bullish Fund and AMEX:UDN: US Dollar Index Bearish Fund.
Bonds Timing Indicator (AMEX:TLT)

Want to trade Bonds? Use our signals with Lehman?s 20 year ETF AMEX:TLT. The direction of bonds has an impact on the stock market. Normally, as bonds go down, stocks will go up and as bonds go up, stocks will go down.
OIL Timing Indicator (AMEX:USO)

Want to trade OIL? Use our signals with AMEX:USO, the OIL ETF. We look at the price of oil as its level and direction has an impact on the stock market.
Secondary Stock Market Timing Indicator

We maintain hundreds of popular and proprietary technical indicators that break down market internals, sentiment and money flow to give YOU unique insight into whether you should BUY or SELL the market. We feature at least one here each day in support of our current outlook.
As a subscriber to the Daily Stock Barometer System, you also get access to all our charts and research. Email Customer Support at stockbarometer@gmail.com to upgrade your subscription.
Daily Stock Market Outlook
The barometer has moved into Buy Mode, however, we continue to await a higher close or a break to give us better entry. We're also starting to see more potential for a reversal lower. We'll advise as the day progresses if we're going long. Probably tomorrow am if we're going short.
The above chart shows the equity index put call ratio. This is my ultimate sentiment measure - beccause it's not just a survey, it's what people are doing with their money. Normally when it peaks, you're better served to look for downside.
Talking about Sentiment, by Thursday we have the weekly II and AAII data (below). The yellow line is best, and it just turned lower. The black line is the market. The red line is the AAII data, which is volatile, so we smooth it with the orange line - and get a curve that matches the II data pretty closely... At the end of the day, both are pointing lower. Which can be bearish.

On Gold, option writers are starting to position for more downside.

Here's our current positioning.
- Last Recommendation - 7/11 - SHORT QQQ
- Status - You should have been stopped out of this trade - await our next call.
- Consideration - Always maintain stops per money management above.
If you want to learn more about some of my models and indicators, I use my blog to cover them in more detail. If you're looking for more information, please visit our blog - I'll have updates and publish other articles there.
Regards,


