


The "evidence" => corrective internal structure of the pullback from last Friday's top could be suggesting immediate higher levels BUT given:
- The overbought readings of momentum and breadth indicators that were reached last week.
- A potential completed EWP
It is possible, that the 5 - wave up from September 5 higher low at 1401.25, has established the top of the Triple Zig Zag from the June lows.
If this is the case, which is not confirmed yet, as we need to see a lower high, I expected that SPX would enter a potential multi-week pullback phase.
Lets go to the charts.
First one is a 5 min chart where we can see that price has traced an apparent harmless pullback, which I have labeled as a Triple Zig Zag.

Keep in mind that for a long long long time every single corrective pullback has been aggressively bought.
Instead I "dare" to consider that price at yesterday's lod has completed the wave (A) of a larger Zig Zag o Double ZZ down.
If this scenario plays out then a likely rebound will have to fail to achieve a higher high. The "logical" area for the failure is located in the range 1465 - 1467.50
The next chart is the one that I have been posting since last Friday.
Here I have the "major" EW reason that should open the door to a larger corrective phase: The impulsive 5 - wave up leg.

- The trend line remains the barrier that has to be broken in order to expect the resumption of action to the down side.
- Key levels below yesterday's lod are 1440 and 1428.
Once the door of the correction is opened, theoretically, the pullback could last at least one month and might reach the 0.382 retracement at 1395 where today we also have the rising 50 d MA.
In the worst case scenario price should find a bottom at the rising trend line from the October 2011 higher low.
In order that such a bearish scenario pans out price will have to breach a "huge" support in the area 1424 - 1422.

In addition to the wave structure also momentum and short term breadth indicators are suggesting that price needs a healthy pause.
1. Momentum:

- Daily RSI from an overbought reading it has breached the trend line support in force since September 5.
- Stochastic form the overbought zone it has issued a bearish cross.
2. Breadth:
The weakness of the McClellan oscillator is quite intense despite SPX choppy price action.

If my bearish short-term scenario plays out then I also expect a correction of EUR, Oil, Gold....etc. (Risk assets), and a rebound of USD & Bonds.
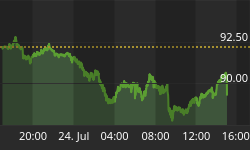
A potential bullish falling wedge of the "fear index" (VIX) would strengthen the short-term bearish scenario for the equity market.

Conclusion:
- The wave structure & momentum / breadth indicators are suggesting that price could begin a corrective phase.
- The confirmation needed is a lower high.
- I am NOT looking for a MAJOR reversal.
- The 0.382 retracement at 1395 could come into play.
- The LONGER-TERM time frame TREND will remain up as long as price does not breach the 200 d ma which today stands at 1351.
- It is possible that the resolution of the short-term pattern will occur next Friday (quarterly OPEX) or next Monday.


