


Originally published October 2nd, 2012
Action in the Precious Metals markets yesterday was VERY bearish and confirms our suspicion that an intermediate top may be forming that could lead to a brutal correction. Yes, yes, we know how bullish open-ended QE is for gold and silver and how the dollar is doomed etc, but so does everyone else - and the latest COTs show that both Large and Small Specs have thrown everything they have got at this uptrend, as we observed at the weekend. The trade is now dangerously overloaded on one side of the scales and a larger dollar rally, which looks likely on technical grounds, could trigger a sudden rout in the PMs.
Gold made new highs intraday yesterday, as we can see its 3-month chart below, but couldn't hold the gains and fell back into the potential intermediate top pattern, leaving behind a candlestick on its chart that approximates to a bearish "Shooting Star", the second such bearish candlestick in just over a week. Volume has remained high as the price has tracked sideways, another warning that a top may be forming, and of course, these warnings follow failure of the uptrend shown. Tactics for traders here are clear cut and simple - TAKE PROFITS AND GO SHORT, but reverse position immediately following a close above yesterday's intraday high, should this occur. This of course will sound pure lunacy to many of you reading this, which is exactly why it could work out well, and anyway, with the stop out point so close by above and well defined, where's the risk??

The gold COT chart required rescaling because the Commercial short and Large Spec long positions "flew off the scale". Although these positions can of course get even more extreme if gold makes another upleg, they indicate a high probability that an intermediate top is forming, especially given yesterday's action in the gold market.

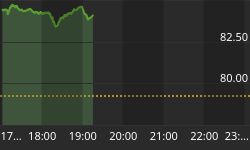
What about the broad market? - although its shorter-term uptrend has not (yet) failed, unlike gold and silver, as we can see on its 3-month chart below, action in the recent past has been negative, with a bearish "Gravestone Doji" appearing on the S&P500 index chart on the highest volume for many months, which we took as a warning at the time, and yesterday a large, bearish "Shooting Star" candlestick appeared on the chart that portends imminent failure of the uptrend that could lead to a steep drop.

Now we come to the all-important outlook for the dollar. While we are amongst the first to admit that the outlook for the dollar is not exactly rosy, what with its enemies at the Fed ganging up to destroy it, short-term it is quite heavily oversold, as we observed at the weekend, and could be due a larger rally as projected on the chart below to complete its potential Head-and-Shoulders top. Such a rally would be the perfect excuse for a sharp correction in the Precious Metals.

In the light of the above observations it is thus most interesting to examine the latest Euro FX COT. This chart shows that Large and Small Specs have collapsed their short positions in the euro back almost to the zero line, which means that they have ceased to be bearish on the euro, which also means that they have ceased to be bullish on the dollar. Back in the Summer the Large and Small Specs, force fed with a diet of misleading news by the mainstream financial media, were encouraged to go heavily short the euro, and they were subsequently fleeced when it staged a big rally, while the Commercials were laughing all the way to the bank, as usual. This chart suggests that a larger dollar rally is in the works. Of course the dollar's fundamentals are awful, but at this point that could all be priced in.


