


The rebound is much stronger then I was expecting with price easily recovering above both the 10 & 20 d MA and achieving an eod print above the 0.618 retracement of the down leg off the October 5 lower high.
We have a daily Marubozu, which could be an exhaustion candlestick if today we have a small range body or a reversal bar.

Obviously the question that you should ask me is:
Is the correction over?
I am not stubborn, I never obstinate with a given EW count, but so far I am firmly convinced that EW wise the pattern from the September 14 high needs a pending wave (C) down in order to be considered completed.

Therefore if I have not wrongly labeled the current rebound (off last Friday's lod), once is over it should be fully retraced:

But in order to be on the right side of the price's path it is mandatory that price MUST reverse today since both momentum and breadth indicators are threatening to kill the short-term bearish set up:
- We have a new bullish cross of Stochastic so the RSI MUST not break above the trend line resistance.

- The McClellan Oscillator has breached the trend line resistance and it is back above the zero line. It looks like a breadth thrust so if the Oscillator moves above the October 5 peak it will seriously question the bearish set up.

It is not only what could be described as a biased opinion since it would be very odd that SPX has resumed the intermediate up trend without the banks.
Below in the daily chart of KBE it seems reasonable to consider that price is going in the opposite direction.

Conclusion:
- Based on what the EWP of SPX is suggesting I seriously doubt that the correction in progress from the September 14 high is over.
- Probably we cannot give for granted anymore that price will substantially break the 1422 pivot support with the pending wave (C) down.
- The short-term bearish set up requires an immediate reversal.
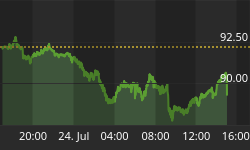
Lastly lets watch VIX.
Yesterday's hammer may be suggesting that SPX "oversold" rebound is getting close to an end.

Tomorrow I will not publish the short-term follow up.


