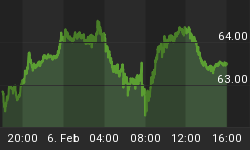
Due to the technical reasons I have been discussing during the last two days I maintain my short-term bullish bias, so I am looking for an oversold bounce.
Today I highlight:
- Stochastic is extremely stretched
- Positive divergence of the NYSE Adv-Dec Volume + yesterday it crossed the zero line.

Regarding the location of price within the corrective pattern in progress off the September 14 high (Double Zig Zag), I am switching my preferred count to the black label.
Therefore if this count is correct price should be on the verge of ending the wave (A) of the second Zig Zag. The next sequence should be a corrective bounce wave (B) followed by the last wave (C) down.
We have two consecutive bottoming candlesticks. So far the first one has to initiate the overdue rebound so if today with yesterday's Doji bulls fail again then the odds of a drop to the next obvious support at 1396 would substantially increase.
Above the current eod print it is also obvious that bulls have to reclaim 1422 (previous support now resistance).
If the short-term bounce plays out then it may be shallow.
The target should be located in the range of Tuesday's gap at 1433.81 + the 50 d MA at 1434.
In the worst case (for the Bears) price should reverse at the 20 d MA = 1441
In the weekly chart below we can see that price has almost reached the 20 w MA, which could be the "right" spot for a short-term pause.
In addition with a small bounce today, SPX could end the week with a Hammer
Regarding the short-term price action price could be unfolding an Ending Diagonal that would complete the assumed wave (A).
If today the ED plays out then, once/if Bulls achieve an eod print above 1422, the following wave (B) rebound should top next week in the range 1433,81 - 1441.
As I mentioned on Thursday I am closely monitoring VXX.
Yesterday it confirmed a bullish divergence for equity, with lower low/high and the inability to fill the opening gap down.
I expect price to fulfill the Double Top target at 35.09.
Obviously if VXX has began a short-term pull back SPX should do the opposite.
VXX going forward will be my favorite indicator in order to gauge the potential SPX rebound and it will likely offer also an interesting long set up once the correction is over.
HAVE A GREAT WEEKEND


