


Six Reasons Bulls Should Be Very Concerned:
- Gridlock remains in Washington.
- Fiscal cliff negotiations could be messy.
- The VIX is sending up warning flares.
- Europe's economy and debt markets remain shaky.
- Commodities are questioning Fed's effectiveness.
- Technical evidence overwhelmingly shows bullish deterioration.
Gridlock and Long To-Do List
After endless media coverage, countless speeches, and millions spent to influence voters, little has changed since the polls were opened on Tuesday. From the Washington Times:
An angry electorate begging for change did little to upset the balance of power in Washington, where gridlock has reigned and shows no signs of letting up. he agenda is extensive and seemingly growing longer every week: Another trillion-dollar deficit is looming in 2013, debt has topped $16 trillion, the immigration system is broken, the tax code needs an overhaul, gas prices and unemployment remain stubbornly high, Iran's nuclear program looms ever larger, and al Qaeda may be resurgent in parts of the Middle East.
Numerous Obstacles To New Highs
Investing is about understanding probabilities. We have been concerned about the deteriorating prospects for investors for some time, pointing out slowing momentum in technology stocks on September 10. On September 24, we asked Are Stocks Beginning to Peak? Currently, the odds are stacked heavily in the favor of lower lows in stocks over the coming weeks.
Could we see an oversold bounce? Sure, but the evidence says any rally would most likely be an opportunity to reduce our risk exposure rather than increase it. Using the S&P 500 support and resistance chart below, we can see seven forms of possible resistance standing between the S&P 500 and higher highs. The door to higher highs still has a small crack in it, but any rally could be greeted with institutional selling between 1440 and 1480. S&P 500 scenarios based on DeMark exhaustion counts are outlined at the 00:30 mark of a recent video.

Warning: Cliff Ahead
Politicians kicked the fiscal can down the road in late 2011. Since then, little-to-no progress has been made regarding our unsustainable budgetary path. From MSNBC:
Congress will remain split between the two parties, keeping open the likelihood of messy negotiations to avert the looming "fiscal cliff" - nearly $600 billion worth of spending cuts and tax increases that risk pushing the economy into deep recession.
Fear Is Increasing, Risk Appetite Waning
The chart below shows the performance of the S&P 500 relative to the VIX Fear Index (VXX). When the ratio is rising, risk-on is in favor. When the ratio drops, investor concerns about future market volatility are increasing. Point A shows a bearish signal for bullish momentum that came in April 2012. Point E highlights the weakness in stocks that followed. Notice the current market (point B) looks similar to April 2012 (point A). At point C, risk-on broke support relative to risk-off, which foreshadowed further declines in stocks (point E). A similar break of risk-on support is trying to take hold this week (compare point D to C). The ratio has also dropped below its 22-week moving average, which all things being equal is a bearish sign.

Europe: The Never-Ending Debt Saga
We outlined the big picture issues in Europe in a 2011 video, which means we have a good understanding of the severity of excessive debt. Other than talk, very little action has been taken by policymakers or the European Central Bank (ECB). A simple Q&A helps illustrate:
- Has Spain requested a formal bailout opening the door to ECB bond buying? No
- Has Italy requested a formal bailout? No
- Has the ECB implemented the much-publicized and game-changing bond buying program? No
- Is the situation in Greece improving? Not yet
- Have France and Germany been able to sidestep economic weakness? No
Tech Stocks Slice Through 200-Day
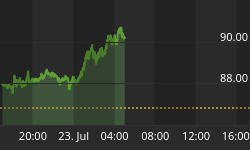
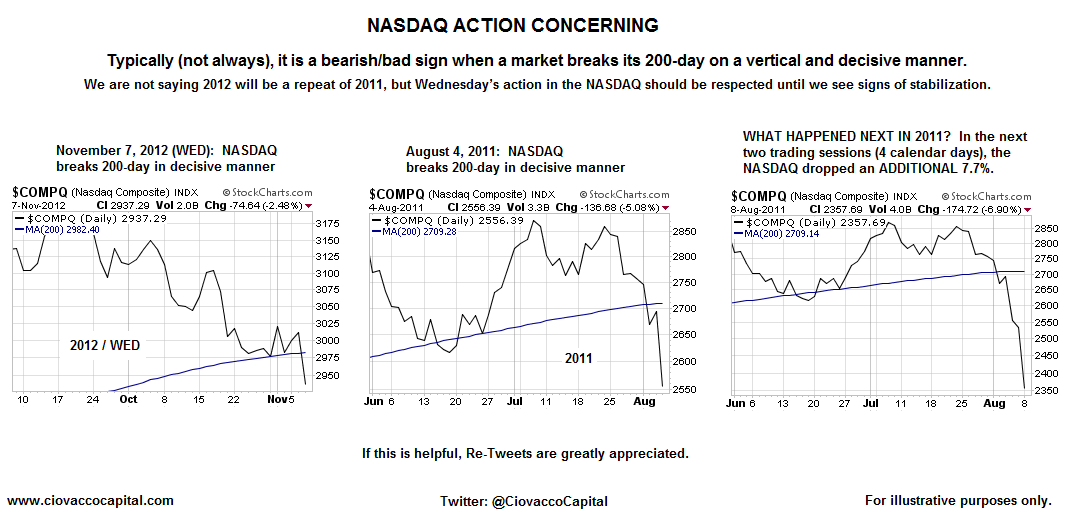
Traders view 200-day moving averages (MA) as bull/bear demarcation lines. A healthy market remains above its 200-day moving average. Significant damage in bear markets and corrections almost invariably takes place below 200-day moving averages. On November 8, the NASDAQ slashed through and closed below its 200-day MA.

The last time we experienced such a sharp break of the NASDAQ's 200-day? August 2011 when Congress was bickering about wildly mismanaged budgets (sound familiar?). A more detailed look at what happened in 2011 can be viewed via this image.
Draghi: Downside Risk In Europe
Fresh off the Thursday morning MarketWatch press:
European Central Bank President Mario Draghi maintained a downbeat outlook on the euro-zone economy Thursday, telling reporters at his monthly news conference that risks to the outlook remain weighted to the downside. Economic indicators signal further weakness in the second half, while survey data offer no evidence of a pickup before the end of the year.
Intermediate-Term Trend Is Down
A downtrend is formed when markets make a series of lower lows and lower highs. A good way to monitor the health of the market's intermediate-term trend is to watch the slope of the S&P 500's 50-day. Good things tend to happen when the 50-day has a positive slope (see green arrow below). Bad things tend to happen when the slope rolls over in a bearish manner (see red arrows). The slope currently says "be careful" with risk assets. Notice "bounce" below highlights that one-to-three week countertrend rallies are always a possibility even under bearish conditions.

Commodities Question Fed's QE3
Quantitative easing is about inflating asset prices. The red circles below highlight bearish momentum building in commodities (DBC). Notice the last time a bearish momentum signal was present (point A), stocks dropped (point B). We have a similar signal present today (point C).

Stocks vs. Bonds
If you want another flavor of risk-on vs. risk-off, the performance of the S&P 500 relative to the aggregate bond ETF (AGG) could be your cup of tea. RSI closed below the bull/bear demarcation line of 50 on Wednesday (see below). The bullish blue support line from the October low appears to be on the verge of giving way, which means the trend of risk-on is now in doubt.

Markets never make anything easy for anyone. Therefore, despite the avalanche of bearish evidence, it is important to understand that under present conditions multiple week countertrend rallies often occur. Regardless of whether or not the S&P 500 revisits 1440 or goes on to make new highs, until the evidence and news improves, we will remain defensive and skeptical. The charts say what they say until they don't say it anymore, which means we should always be willing to accept bullish information as it surfaces. We currently have a large cash position and hedges for our longs in the form of a VIX ETF (VXX) and an inverse small-cap ETF (RWM). As conditions change, we will post some updated versions of the charts above on Twitter (@CiovaccoCapital).


