


Originally published December 23rd, 2012.
Many silver longs were upset by the rather sharp drop over the past week or so, but as we will now see, this drop looks like a 'storm in a teacup' on longer-term charts.
On its 12-year chart, which goes back to the start of the bullmarket, we can see that the top boundary of the uptrend from 2004 is defined by the line drawn across 4 important peaks, and it is from this line that the parallel supporting trendline beneath is derived. While there is no law stating that the lower trendline has to be parallel, it is nevertheless likely, and it is regarded as no coincidence that the strong support at recent lows, which needs to hold, and this lower trendline are close together at this time - if the current reaction continues this is the area where it should stop and reverse, although as we will see later on the 6-month chart it may not drop back any further than where it is now.

Having gotten a perspective on the entire bullmarket, we will now look at the action from the 2006 peak in more detail on a 7-year chart. On this chart we can see more clearly where silver will arrive at a 'buy spot' if the current reaction continues, in the green oval. Since the August 2011 peak silver has been trading in a bearish Descending Triangle, with a very clearly defined line of support at its lower boundary, which it broke out from to the upside in August, a bullish development. Even after last week's decline the recent reaction back looks like a correction to the 1st impulse wave out of the Triangle, which has brought the price back towards support at the top boundary of the Triangle. For the bullish case to remain intact the price should go no lower than the green oval shown, where silver will be a buy, with stops below the support or the lower trendline. Here we should note that the setting of stops with silver is not as 'cut and dried' as it is with gold, as by the time you are stopped out of it, if your stop is below the trendline, it will be at about $24, and the next serious support starts to come into play not so far beneath in the $20 area.

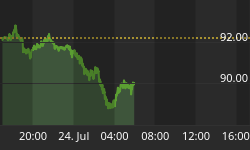
Although the 6-month chart for silver looks pretty grim at first sight, with it falling relentlessly for 7 trading days in a row and breaking below its early November lows, on closer inspection we can see that it has arrived at the bottom of a tentative channel and is now quite deeply oversold. So it could be right at the bottom of a 3-wave A-B-C zigzag that has served to correct the first impulse wave out of the Descending Triangle that occurred during August and September, which is labeled on the chart. It's too early to say regarding this and it could continue lower to the support shown, although the appearance of the doji on Friday, indicating a state of indecision, could mark the low point.

Silver's retreat of the past several weeks was presaged by a strongly bearish COT structure, and while the readings on the chart shown below, which is only up to date as of last Tuesday night's close, can be expected to have moderated further as the week went on, in response to the lower silver prices that ensued, Commercial short and Large Spec long positions can be reasonably presumed to be still at high levels which urge a measure of caution short-term.


