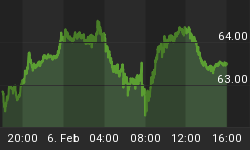
No Change of the short-term scenario.
The risk remains high for a multi-day pullback. The overdue pullback should not endanger the intermediate up trend since I am confident that price will only undertake a partial retracement of the November up leg.
Given that the current up leg can belong to one of the two Ending Diagonal options discussed in my last SPX long-term EWP update it is not an easy task to establish the exact location of price within the ED's up leg (wave III or wave V).
We know that these waves subdivide in Zig Zag so I assume that given the extreme overbought reading of the daily stochastic price should be on the verge of completing the wave (A) of a larger Zig Zag.
If this is the case then price should soon begin a multi-week pullback wave (B).
As you know I have been following a potential Ending Diagonal that could complete the assumed wave (A).
Yesterday I suggested that price could have truncated the mentioned ED, well I was wrong but the Ending Diagonal project is still valid.
As we can see in the SPX 30 min chart below, price has achieved a marginal higher high, hence if the ED pan out a reversal can occur today.
If the ED is the correct pattern then the loss of 1463.76 should trigger sell-stops intensifying downs side action.
Once/if we get the overdue correction underway and the pullback is the assumed wave (B) then it should at least reach the target box in the range 1434 - 1419, we might see a battle between bulls & bears at the trend line support in force since the November 16 low.
In the technical front:
- The Stochastic of the McClellan Oscillator has issued a sell signal

- Momentum keeps flashing heads up with the RSI possible Double Top and persistent negative divergence and a stochastic extremely overbought.
I will begin publishing a "virtual" swing-trading table. The setups will be established in the daily updates or during trading hours I will post the ideas on Twitter/Stocktwits. I will review the swings planning in the weekly technical analysis.
The first trade has been opened yesterday with a long position in UGL (Ultra long Gold ETF). This set up has been discussed recently and it is based upon a countertrend rebound out of a potential Leading Diagonal.
In addition to the potential short-term bullish pattern, momentum is strengthening the scenario of a larger rebound.

Today I have SPXU in my radar screen; the potential long trade is based upon the SPX Ending Diagonal idea.


