


In our last look at the oil market we alluded to the parabolic dome-shaped structure in the oil futures chart, which clearly indicates a short-term topping process underway. This should present a welcome relief from the runaway energy prices we've endured since last year and will give the financial markets some much-needed breathing room as we enter the second quarter after a not-so-hot first quarter.
When last we looked at the oil chart a couple of weeks ago we talked about the rising wedge pattern (which had traced out the classic 1-2-3-4-5 alternation pattern typical of such patterns just before a reversal in price) coupled with the parabolic dome mentioned previously. These two dominant chart features combined to present a bearish short-term picture for crude.
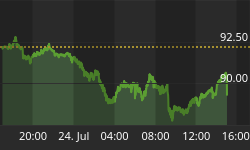
Below is the latest oil chart as of April 5. There is still enough upward momentum to keep the price of oil buoyant and somewhat jumpy in the immediate-term. Yet the resistance is mounting.

Last time we looked at some news headlines that suggested an approaching top in the oil market: "Bullish U.S. predicts $50 oil price next year," "Oil price jumps to record levels as analysts up estimates," "Inflation measure signals revival of price pressures," "Lack of new refining capacity puts pressure on supplies of oil, "Call for world to turn away from oil," and "Getting used to oil at $50." As previously stated, you'd be hard pressed not to find a series of fear-laden oil headlines in any newspaper or news magazine in the country right now as the emotional response to the oil trend is reaching explosive proportions.
Indeed, the past week has witnessed a crescendo in the worry over the oil price spike. Wall Street analysts and financial news commentators have given all their focus to the crude oil market in recent days as the $57-$58 area was been tested earlier in the week. The Financial Times of London states, "Fears for corporate earnings as rampant oil prices hit fresh highs," while Business Week proclaims "Follow the Raging Oil Bulls"! Meanwhile, the IEA is seeking an emergency oil plan as Goldman Sachs warnings of a $105/barrel "super-spike" in the price of oil. It's all enough to make one's head spin and to think that all of this came out in just a 2-day period!
Yet isn't this what normally accompanies a topping process? How many times have we seen this same pattern repeat itself in recent years? It goes something like this: As a commodity reaches a pivotal short-term or intermediate-term top, the talking heads come out in droves to tell us how prices are just going to soar that much higher into the foreseeable future. But this much super-bullish rhetoric is usually a case of excessive optimism and only succeeds in solidifying the price peak in most cases.
In keeping with our ongoing discussion about the rate of change slowdown in the money supply and the possibility for an economic slowdown later this year, how does this fit the picture for rising oil prices? Well obviously a decrease in liquidity would put a damper on the demand for oil, especially once this slowdown hits the much bigger global economy. And as the renowned economic expert Ed Yardeni (www.oakassociates.com) has stated in his recent commentaries, the sharp drop in the growth of global liquidity since last summer suggests that oil demand growth should slow soon as well. As Yardeni has pointed out, "The growth in Foreign Official Dollar Reserves (FRODOR) is a....12-month leading indicator of the growth in world crude oil demand....The 52-week growth rate of FRODOR is down to 15.8% during the week of March 29 from the latest cyclical peak of 36.2% during the week of August 18, 2004. The slowing in global liquidity suggests that global demand growth should peak soon, and so should the price of oil."
Yes, we still have a "fear market" in oil. And as we've all seen in the recent past, whenever fear runs high at extremes it eventually leads to a reversal of the prevailing trend.


