


The good news is:
• April is one of the strongest months in the 1st year of the presidentialcycle.
• There is evidence of a bottom.
Near the end of last week new lows on the NASDAQ decreased enough to turn the indicator upward. Although it is too soon to be sure, this is the first positive sign we have had from that indicator in about 6 weeks.
The chart below shows the NASDAQ composite (OTC) in red and a 10% trend (19 day EMA) of NASDAQ new lows in blue. The new low indicator (NL) has been plotted on an inverted Y axis so when new lows are decreasing the indicator moves upward and when new lows are increasing the indicator moves downward. The chart begins August 5, 2004 and dashed vertical lines indicate the 1st trading day of each month. You can see how the indicator moved sharply upward after the August low. The indicator began turning upward last Thursday. Very short term the indicator can give false signals so it is prudent to wait for 5 consecutive trading days of upward movement before assuming a bottom is in.

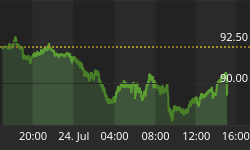
A similar chart using NYSE data is a little more promising.
The S&P 500 (SPX) is shown in red and NL calculated from NYSE data is shown in brown.
The indicator has been moving sharply upward for over a week.

Last week the Russell 2000 (R2K) was up for 4 consecutive days before losing all of its gains on Friday. The chart below shows the R2K in red and an indicator that plots the percentage of the previous 4 trading days that were up in green. The indicator reaches the top of the screen when there have been 4 consecutive up days and it reaches the bottom of the screen when there have been 4 consecutive down days.
At or near the August low the indicator touched the bottom of the screen indicating 4 consecutive down days. It then moved to the top of the screen indicating 4 consecutive up days. There were several periods when the indicator touched the top of the screen between August and December and the indicator never touched the bottom of the screen during that period. The first sign of trouble came in early December when there were 4 consecutive down days and the indicator touched the bottom of the screen for the first time since August. Until last week, the indicator had not touched the top of the screen since mid-December.
Another sign that a bottom is likely to be behind us.

The bad news:
• The secondaries lead both up and down.
The chart below shows the Russell 2000 (R2K) in red, the S&P 500 (SPX) in green and a FastTrack relative strength indicator called Accutrack as a histogram in yellow.
The underperformance of the R2K relative to the SPX increased last week.

Next Friday is options expiration and seasonally the week prior to options expiration in April has been pretty good.
The tables below show the daily performance of the R2K and SPX since 1988 with a breakdown of the 1st year in the presidential cycle.
Report for the week prior to witching Friday during April.
Witching is futures and options expiration the 3rd Friday of the month.
The witching Friday is marked *Fri*.
The number following the year is the position in the presidential cycle.
| R2K | ||||||
| Year | Mon | Tue | Wed | Thur | *Fri* | Totals |
| 1988-4 | 0.00% | 0.00% | 0.00% | 0.00% | 0.00% | 0.00% |
| 1989-1 | -0.11% | 0.52% | 0.10% | 0.08% | 0.44% | 1.04% |
| 1990-2 | -0.99% | -0.08% | 0.16% | 0.08% | -0.57% | -1.41% |
| 1991-3 | -0.02% | 0.89% | 0.78% | -0.63% | -0.65% | 0.37% |
| 1992-4 | -1.64% | -0.24% | 0.15% | -0.15% | -0.08% | -1.95% |
| 1993-1 | -0.45% | -0.36% | 0.34% | 0.11% | -0.42% | -0.78% |
| 1994-2 | -0.70% | -1.12% | -1.42% | 1.31% | 0.50% | -1.42% |
| 1995-3 | 0.45% | 0.10% | 0.35% | 0.31% | 0.18% | 1.39% |
| 1996-4 | 0.73% | 0.74% | 0.33% | 0.46% | 0.46% | 2.72% |
| 1997-1 | -0.19% | 0.64% | -0.16% | 0.06% | 0.38% | 0.73% |
| 1998-2 | 0.37% | 0.53% | -0.05% | -1.26% | -0.95% | -1.37% |
| 1999-3 | -2.18% | 0.71% | 2.70% | 0.53% | 0.67% | 2.45% |
| 2000-4 | -2.76% | 4.37% | -0.98% | 2.13% | 2.36% | 5.13% |
| 2001-1 | -1.21% | 0.28% | 2.25% | 1.02% | 1.34% | 3.68% |
| 2002-2 | -0.53% | 1.99% | -0.80% | -0.04% | -0.23% | 0.40% |
| 2003-3 | 0.42% | 1.52% | 0.97% | -0.68% | -0.96% | 1.27% |
| 2004-4 | 0.61% | -1.90% | 1.29% | 1.72% | -0.43% | 1.29% |
| Avg | -0.51% | 0.54% | 0.38% | 0.32% | 0.13% | 0.85% |
| Win% | 31% | 69% | 69% | 69% | 50% | 69% |
| R2K Presidential Year 1 | ||||||
| Year | Mon | Tue | Wed | Thur | *Fri* | Totals |
| 1989-1 | -0.11% | 0.52% | 0.10% | 0.08% | 0.44% | 1.04% |
| 1993-1 | -0.45% | -0.36% | 0.34% | 0.11% | -0.42% | -0.78% |
| 1997-1 | -0.19% | 0.64% | -0.16% | 0.06% | 0.38% | 0.73% |
| 2001-1 | -1.21% | 0.28% | 2.25% | 1.02% | 1.34% | 3.68% |
| Avg | -0.49% | 0.27% | 0.63% | 0.32% | 0.44% | 1.17% |
| Win% | 00% | 75% | 75% | 100% | 75% | 75% |
| SPX | ||||||
| Year | Mon | Tue | Wed | Thur | *Fri* | Totals |
| 1988-4 | 0.00% | 0.00% | 0.00% | 0.00% | 0.00% | 0.00% |
| 1989-1 | 0.12% | 1.43% | 0.37% | -0.31% | 1.12% | 2.72% |
| 1990-2 | -1.21% | -0.21% | 0.51% | 0.27% | -1.14% | -1.79% |
| 1991-3 | 0.21% | 1.69% | 0.73% | -0.51% | -1.10% | 1.02% |
| 1992-4 | -1.41% | 0.02% | -0.11% | 0.44% | -0.63% | -1.69% |
| 1993-1 | -0.33% | -0.53% | -0.33% | -0.94% | -0.55% | -2.68% |
| 1994-2 | -0.83% | 0.02% | -0.13% | 1.53% | -0.25% | 0.34% |
| 1995-3 | 0.87% | -0.15% | 0.11% | 0.17% | 0.23% | 1.22% |
| 1996-4 | 0.44% | 0.57% | -0.22% | 0.42% | 0.09% | 1.30% |
| 1997-1 | 0.82% | 1.48% | 1.17% | -0.23% | 0.60% | 3.84% |
| 1998-2 | 0.08% | 0.27% | 0.34% | -0.97% | -1.04% | -1.32% |
| 1999-3 | -2.24% | 1.29% | 2.29% | 1.70% | -0.14% | 2.90% |
| 2000-4 | -0.33% | 3.33% | -1.11% | 0.27% | -0.85% | 1.30% |
| 2001-1 | -1.50% | -1.22% | 1.59% | 0.47% | 1.50% | 0.85% |
| 2002-2 | -0.76% | 2.34% | -0.20% | -0.14% | 0.06% | 1.30% |
| 2003-3 | -0.18% | 2.17% | 0.84% | -0.83% | -1.38% | 0.62% |
| 2004-4 | 0.11% | -1.56% | 0.53% | 1.41% | 0.06% | 0.55% |
| Avg | -0.38% | 0.68% | 0.40% | 0.17% | -0.21% | 0.65% |
| Win% | 44% | 69% | 63% | 56% | 44% | 75% |
| SPX Presidential Year 1 | ||||||
| Year | Mon | Tue | Wed | Thur | *Fri* | Totals |
| 1989-1 | 0.12% | 1.43% | 0.37% | -0.31% | 1.12% | 2.72% |
| 1993-1 | -0.33% | -0.53% | -0.33% | -0.94% | -0.55% | -2.68% |
| 1997-1 | 0.82% | 1.48% | 1.17% | -0.23% | 0.60% | 3.84% |
| 2001-1 | -1.50% | -1.22% | 1.59% | 0.47% | 1.50% | 0.85% |
| Avg | -0.22% | 0.29% | 0.70% | -0.25% | 0.67% | 1.18% |
| Win% | 50% | 50% | 75% | 25% | 75% | 75% |
There is some evidence of a bottom and seasonally next week is very strong.
I expect the major indices to be higher on Friday April 15 than they were on Friday April 8.
Last week the indices were mixed with the NDX the best performer up 1.1%. The large cap indices were up less than 1% and the small cap indices were down less than 1% so I am calling last weeks positive forecast a tie.


