


All we can do with the stock market indices is draw a few lines and then draw a few conclusions. It was easier with the SnP, but we had more words to add for the NAS. The stock market has been Fed-driven for the past few years as central planners have taken over, so we no longer see free markets, as more and more freedoms in other areas are being trampled over by puppet politicians.
Sometimes there is no need for any sophisticated computer models of myriad mechanical tools like MAs, RSIs, MACD, etc. All one need do is follow the obvious for as long as the obvious remains so. At least that is how central planners seem to work.
Buy breaks and hold until it stops working.

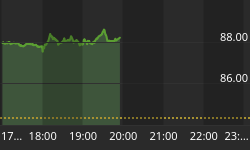
No comment required.

The Fed used to run monetary policy, which has not worked in over 100 years, so now they are running the markets, along with everything else.

At least the NAS has more points of interest against which to gauge how price responds to them. The long-standing half-way retracement between the 2000 high and 2002 low has been 2841 ever since the 2002 low. Last September, NAS tested it and price backed off. Notice how small the range was. It reflected a lack of demand, and selling stepped in, at least for a few months.
The last two months are small ranges, a lack of demand, but there has been a total lack of supply, so as long as price goes higher, stay with it. Close stops at this late stage would be a good idea.

Small bar rallies can mean a lack of demand, but when they persist, as in the November 2011 to April 2012 rally, the steady grind higher is the market's way of punishing shorts who know no better than to ignore a simple trend. Tuition for ignoring trends is so high for so easy a concept.
We see another small bar rally since January 2013, but the slope of the rally is shallower, and the bars are overlapping. Overlapping bars tell of a battle between buyers and sellers, but buyers are still winning. Whatever strategy one might have in stocks, staying away from the short side should be at the top of the list.
Wait and see HOW price responds to the 2872 highs. Then, you will be better informed as to what the market is doing, eliminating any guesswork. Guesswork also has high tuition costs, but they are at least voluntary.

Price could have gone either way out of the 27 day TR, but the smart money was on the upper end for a resolve. You had the SnP as a guide, and the fact that the NAS TR gave back so little ground during the corrective phase suggested accumulation.
How price responds to the overhead resistance, which everyone sees will be valuable information in formulating the next plan. Do not change the current one, unless it is on the short side.
Hard to ignore such an easy message in these two markets.


