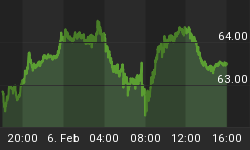
The HUI continues to plummet, to crash, exactly as we have projected. I left the blue arrow for Micro degree wave 3 in the exact spot we drew it last Friday. The HUI got spanked for another 20 points this week. But its MACD is still nowhere near oversold.
Three weeks ago, with the $HUI Gold Bugs Index at 217, we warned that this index was about to begin Minuette degree wave iii down, was about to plummet. Since then $HUI dropped exactly as expected, crashing 37 points to a closing low of 180.6 today, Friday April 15th, or 17 percent. In doing so, it broke through the neckline of a Bearish Head & Shoulders pattern. With the Bearish Head & Shoulders pattern confirmed, the odds are high that more significant downside is coming, with a minimum downside target driving prices to as low as 152ish.

Waves iii through v should carry prices much lower to their wave C bottom. Where might C of 2 bottom? Based upon the Elliott Wave count, a 38.2 percent retrace of Intermediate degree wave 1's rally from 35.31 on November 16th, 2000 to 258.02 on January 6th, 2004 suggests a bottom for the current Intermediate degree wave 2 decline of 172.94 (almost there). A 50 percent retrace takes prices to 146.67. Interestingly, should Minor degree C end up equal to Minor degree A, that would suggest a bottom of 154, very near the H&S target. After the carnage, we should be at the bottom of Minor degree C of 2, to be followed by a powerful rally for several months or even years, Intermediate degree wave 3, probably in response to more Dollar devaluation.
Our subscribers gain a unique advantage with this information, along with a host of other technical analysis research, charts, and data for a modest annual fee of $250 per year. We offer less expensive six month subscriptions, and also free 30 day trial subscriptions for folks just discovering us.
We publish technical analysis newsletters of the major U.S. Equity, Bond, Commodity, Precious Metal, and Currency markets, using multiple tools simultaneously, including Elliott Wave Theory, Supply and Demand, Momentum Measures, Dow Theory, Chart Patterns, Cycles, Sentiment Measures, Fibonacci Ratio Measures for Price and Time turn-date targets, and Analogs of Current Price Behavior with the Past to name a few.
To Subscribe and receive access to these expanded newsletters, Trader's Corner, and our Proprietary Short and Intermediate-term Technical Indicator Indices, I invite you to visit our website at www.technicalindicatorindex.com and simply click on the Subscribe Today! button.
"In God I have put my trust;
I shall not be afraid,
What can mere man do to me?"
Psalms 56:4


