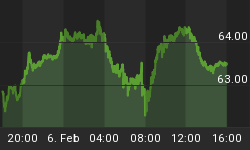
We have been posting the Institutional Investor Accumulation/Distribution chart (from our Standard subscriber site) on this free member site for the past two weeks. We will post it again today, but then refrain in posting it for a while in fairness to our paid subscribers.
Here is what the Institutional Investors are doing right now ...
They are still in Accumulation, but if you look at the chart, it is in a down trend which signifies that they are currently lessening their exposure to the market.
Do note that I drew trend lines from December to yesterday on the NYA Index and the Institutional Accumulation levels.
What do you notice about the two trend lines?
The answer is that while the NYA Index's trend line is moving higher over time, the Institutional Accumulation levels were trending lower which means that the higher the market goes, they participate in the move but with less exposure on each subsequent move up.
Note: The interesting thing about this chart is that investors could just mimic what Institutional Investors are doing and use it as a trading system. (This chart is posted everyday on the Standard subscriber site in Section 4, as Chart number 7.)


