


Here are some important facts about gold. The long-term uptrend in force since the start of this bull market remains intact. The price is currently in the late stages of a symmetrical triangle trading range that started to form following the peak early in December. Symmetrical triangles can break either way, but other factors normally provide clues as to the probable direction of breakout. The fact that this triangle is forming above and within a zone of important support strongly suggests that an upside breakout will eventuate, particularly as the long-term uptrend remains intact and moving averages are now in bullish alignment. The previous major reaction/consolidation, which occurred during the first half of last year similarly ended at a zone of strong support exactly at the long-term uptrend line.

The 4-year chart shows the entire bull market to date. The importance of the long-term uptrend shown is amply demonstrated by the fact that the price has rallied from it on 5 distinct occasions. THIS UPTREND CHANNEL IS VERY IMPORTANT - GOLD IS AN AUTOMATIC BUY WHENEVER IT APPROACHES THE LOWER BOUNDARY OF THIS CHANNEL - AND TRADERS WILL WANT TO HAVE A DEFENSIVE STRATEGY IN PLACE IN THE EVENT THAT THIS CHANNEL FAILS (which is not expected). As it is still close to the lower boundary of the channel, having just successfully tested support there and broken higher, it is a buy at the current price for any interested parties. Silver also looks positive at this juncture, although silver is in the late stages of a much larger symmetrical triangle formation, with correspondingly big implications. Precious metals stocks, many of which have been severely trampled down during this latest gold consolidation, are also an across-the-board buy - sentiment in this sector stinks, which is exactly what you want to see ahead of a substantial rally. Many small exploration stocks in particular are showing signs of completing long low bases.

A 2-year chart is also shown in order that we can see the symmetrical triangle formation in detail, and the underlying support provided by last years price action. This strong support, coupled with the long-term uptrend support shown on the 4-year chart, and augmented by the bullishly aligned moving averages, powerfully suggests that a vigorous new uptrend, taking the price to new highs, is in prospect.

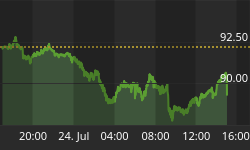
The 6-month dollar chart shows how the dollar has started to wilt, as predicted in the last update, beneath heavy resistance in the 85.50 area, and appears to be starting a new intermediate downtrend, which fits with the interpretation of the gold chart.

The 4-year dollar chart shows the overriding long-term downtrend. The intermediate downtrend late last year appears to have halted at an inner downtrend channel line that can be seen to correspond with the one on the 4-year gold chart.


