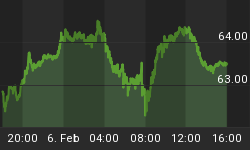
THE MCCLELLAN OSCILLATOR REMAINS WITH A SELL SIGNAL IN PLAY
Despite the Ending Diagonal did not pan out sine once again buyers jumped on and bought the corrective pullback killing a "text book" ending pattern we do have plenty of yellow flags. Probably the foremost in importance is the sell signal issued last week by the McClellan Oscillator, which is still in force also we can add yesterday's negative divergence:

Speaking of negative divergence the list of indicators that are not keeping up with the resilient price action is enlarging:
- RSI huge negative divergence vs its April 11 high and also vs the last lower high on April 30. (Potential Double Top)
- NYSE New Highs/New lows Ratio:

Besides the mentioned warnings we also have an overcrowded bullish Equity Put/Call Ratio. (Contrarian Indicator)

But the fact of the matter is that even though Momentum and Breadth Indicators are suggesting that the odds are favouring at least a short-term pause (Multi-day pullback) I don't see a clear ending pattern yet.
I remain confident regarding the two potential EW counts of the advance from the November lows:
- Option 1: Triple Zig Zag, in which from the April 18 reaction low price is unfolding the last Zig Zag:
- Option 2: Double Zig Zag, in which case from the April 18 reaction low price should unfold an Ending Diagonal. In the chart below, just for fun I suggest an extremely rare ending pattern ===> Expanded Ending Diagonal:
It could pan out only if after a new higher high the following reaction is a sell off with an impulsive decline + the loss of the 20 dma = 1574.50 This is probably just something "illusory" as it would open the door to a sudden reversal of the advance from the November lows
There is another potential Ending Diagonal "project" that would fit with the Option 1, but since the wave (III) cannot exceed above 1600.37 I don't know if this pattern will withstand the usual volatility of a NFP day.
Lastly VIX should give us valuable clues. So far there is a bearish flag that is suggesting a move to a retest of the April 25 low. It could be forming a Double Bottom if 13.13 is not breached (Needed a bullish hammer), otherwise we will have to see if the trend line in force from the March 14 low holds preventing a retest of the March 14 low.
Enjoy the weekend.


