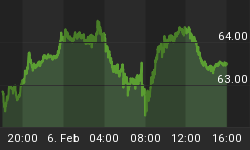
1994: Not A Good Time For Investors
As we noted on May 31, bad things tend to happen when interest rates spike as they did in 1994. Rising rates made the first half of 1994 difficult for both stock and bond investors, something that is relatively rare over longer periods of time. The 1994 scenario could be playing out again as stocks have been dropping while interest rates have climbed higher at a somewhat alarming rate.
First Fed Statements Not Reassuring
Given the present day similarities to 1994, it was possible that Richard Fisher, Federal Reserve Bank of Dallas President, would put his standard anti-QE rhetoric on the back burner when he spoke Monday. That is not what happened. From Bloomberg:
Richard Fisher, who doesn't vote on monetary policy this year, said he favors scaling back the Fed's monthly bond-buying if the economy makes the kind of progress officials are currently expecting. "I agree fully with the chairman that we should dial back on the stimulus" should "we achieve what the 19 of us forecast," Fisher said today in a speech in London. "I've not been a fan of this program," Fisher said today. The economy will need more incentives from fiscal policy makers to reach the point of full employment, he added.
Technicals Similar To Pre-Plunge Periods
From a technical perspective, the similarities that are concerning are tied back to last year. In this week's video, these similarities are noted between the market's current technical profile and vulnerable periods in May and October 2012; the segment begins at the 4:43 mark.
China Joins List Of Downers
Shifting gears to the fundamental front, the China ETF (FXI) has somewhat quietly been getting hammered as economic concerns pile up. Americans have focused on the money-printing induced bonanza that was until recently pushing the S&P 500 to seemingly never-ending highs.

The credit markets in China have reached troubling status. From Bloomberg:
Global stocks fell today, as Chinese equities entered a bear market as the CSI 300 Index (SHSZ300) of China's biggest companies tumbled 6.3 percent, the most since August 2009. The plunge took its loss from this year's peak to more than 20 percent. China's benchmark money-market rates last week climbed to a record as the central bank refrained from using open-market operations to ease a cash squeeze.
Widely Watched Indicator Rolling Over
The less than stock-friendly news has finally caught up with the S&P 500's intermediate-term trend. The 50-day moving average, shown in blue, is used by traders to monitor the health of the market. As shown in the chart below, not too many bad things happen when the 50-day moving average is rising. Concerns about the intermediate-term trend pick up when the 50-day turns down. Over the past few sessions, the closely-watched moving average is starting to turn over, which increases the odds of more downside over the coming weeks.

Investment Implications
We have been reducing risk by raising cash over the past several weeks. Our bias will remain defensive until interest rates calm down, the markets move away from their tapering obsession, and the technicals improve.

A key level on our radar is 1582 on the S&P 500. The S&P 500 closed Monday at 1573. Any sustained push above 1582 would have us become more open to redeploying cash. From a bearish perspective, the longer the S&P 500 remains below 1582, the more attractive cash becomes. We are happy to join a "buy the dip" party, but we need to see hard evidence supporting a sustainable push higher, which was not present during Monday's short-lived push off the lows.


