Reaction to Fed Minutes
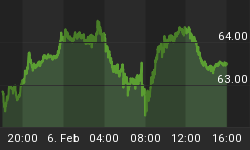
Sometime between late Wednesday and mid-day Thursday, we should get a read on the market's true reaction to the minutes from the last Fed gathering. At some point, the market will take a breather for a day or two in the form of a pullback. If the Fed minutes serve as the catalyst, the recently cleared downward-sloping blue trendline below may act as support.

It seems unlikely the markets will swoon for an extended period due to any tapering-related comments in the minutes. From Reuters:
Peter de Bruin, a senior economist at ABN Amro, said he expected the minutes to show a consensus forming at the Fed to start scaling back its $85 billion-a-month stimulus program in September, following a recent pick-up in U.S. data. "I think we have already seen the main fireworks from the Fed's intentions to taper (scale back stimulus)," de Bruin said. "I would be surprised if we saw another strong rise in yields."
Paying Attention to Stay On Track
One of the best ways to stay aligned with the market is pay attention to what is happening vs. wasting too much energy on what you think will happen or want to happen (forecasting). The major U.S. stock indexes looked vulnerable and were weak technically on Friday, June 21. Since the intraday low on Monday, June 24 they have improved significantly.
Some Hurdles To Cross
The table below shows one of the components of the CCM Market Model. All of the markets and ratios shown are used to monitor investors' tolerance for risk. The markets and ratios are rated on a scale of 0-100%, with 100% being the most favorable. The results on Tuesday, July 10, were bullish overall but the ratings for the major stock indexes ranged from 59% for the S&P 500 to 61% for the NYSE Composite. These are favorable scores but we would feel better if they are able to move into the 65-80% range.

China's Troubles Continue
It seems as if the nothing-but-glowing comments period regarding the Chinese economy has come to an end. Investors have stayed away from emerging markets (EEM), but have not let China derail the bull in the United States. Wednesday provided another less-than-stellar report on the Chinese economy. From the Wall Street Journal:
China's key export sector shrank 3.1% in June compared with a year earlier, down from 1% year-on-year growth in May and the first contraction in a non-holiday month since the height of the financial crisis in November 2009. Imports fell 0.7% year-on-year, pointing to weak demand at home as well as abroad.
Small Caps Lean Risk-On
While the U.S. Indexes still have some technical ground to cover, the supporting cast is in place for another leg higher. All things being equal, investors tend to migrate to smaller growth companies when they feel good about future economic outcomes. Conversely, they tend to migrate away from small caps (IWM) when deflationary or recessionary concerns are gathering steam. Currently, small caps are healthy from a weekly trend perspective.

Credit Markets Tame
Another way of keeping tabs on the tolerance for risk is to compare the performance of riskier "junk" bonds to more conservative long-term Treasuries. When the ratio below is rising, it tends to be bullish for stocks since it reflects confidence that junk bond holders will receive their principal and interest payments in a timely manner.

Investment Implications
Since the S&P 500 was able to clear the key levels of 1628 and 1643, noted Tuesday, we redeployed some additional cash in the well-diversified S&P 500 ETF (SPY). If our models reflect continued improvement in the NYSE Composite, S&P 500, and Dow, we will be more open to gaining additional exposure to leading sectors, such as small caps (IWM), financials (XLF), and consumer discretionary (XLY). Should the S&P 500 retreat below its 50-day moving average (1629), our short-term bias would become more defensive.


