• 968 days Will The ECB Continue To Hike Rates?
  • 968 days Forbes: Aramco Remains Largest Company In The Middle East
  • 970 days Caltech Scientists Succesfully Beam Back Solar Power From Space
  • 1,370 days Could Crypto Overtake Traditional Investment?
  • 1,374 days Americans Still Quitting Jobs At Record Pace
  • 1,376 days FinTech Startups Tapping VC Money for ‘Immigrant Banking’
  • 1,379 days Is The Dollar Too Strong?
  • 1,380 days Big Tech Disappoints Investors on Earnings Calls
  • 1,381 days Fear And Celebration On Twitter as Musk Takes The Reins
  • 1,382 days China Is Quietly Trying To Distance Itself From Russia
  • 1,383 days Tech and Internet Giants’ Earnings In Focus After Netflix’s Stinker
  • 1,387 days Crypto Investors Won Big In 2021
  • 1,387 days The ‘Metaverse’ Economy Could be Worth $13 Trillion By 2030
  • 1,388 days Food Prices Are Skyrocketing As Putin’s War Persists
  • 1,390 days Pentagon Resignations Illustrate Our ‘Commercial’ Defense Dilemma
  • 1,390 days US Banks Shrug off Nearly $15 Billion In Russian Write-Offs
  • 1,394 days Cannabis Stocks in Holding Pattern Despite Positive Momentum
  • 1,394 days Is Musk A Bastion Of Free Speech Or Will His Absolutist Stance Backfire?
  • 1,395 days Two ETFs That Could Hedge Against Extreme Market Volatility
  • 1,397 days Are NFTs About To Take Over Gaming?
  1. Home
  2. Markets
  3. Other

It's Called Monthly Resistance

A few indices like the SPX and DAX have poked their heads above major resistance, but the majority are still being held back with key examples being the TRAN, RUT, NDX, FTSE, BSE and DOW (see previous postings for specific, in depth analysis on the DOW, the multi-year broadening pattern leader).

TRAN Monthly Chart
Larger Image

RUT Monthly Chart
Larger Image

NDX Monthly Chart
Larger Image

FTSE Monthly Chart
Larger Image

BSE Monthly Chart
Larger Image

Even the "dogs" like the MIB, IBEX and CAC that have broken intermediate term downtrends are running into major overhead ... and it wouldn't be surprising to see a backtest of those broken downtrends, would it?

MIB Monthly Chart
Larger Image

IBEX Monthly Chart
Larger Image

CAC Monthly Chart
Larger Image

Things look more like a counter trend rally locked inside a long term falling wedge on the AEX and STOX50.

AEX Monthly Chart
Larger Image

STOX50 Monthly Chart
Larger Image

The AORD out in Asia resembles the AEX, STOX50 in its 50% retrace characteristics.

Australia ASX Monthly Chart
Larger Image

We have clear downward wedging on the NIKK coupled with a couple of "blowout" bearish shooting stars sandwiching a long legged hanged man.

NIKKEI Monthly Chart
Larger Image

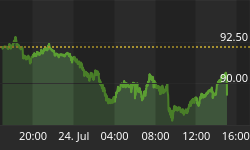
There is support to be found on some charts, just not equity charts though. I'm thinking about bonds as seen here in TLT.

TLT Monthly Chart
Larger Image

It's very clear where price is relative to long term support and resistance by any and every gauge of the concept, and while breakouts higher are possible, at the end of the day the risk/reward assessment for those possible breakouts higher corresponds to you. Personally, I seriously question the viability of a breakout long trade that is anything other than a day trade, and, for obvious reasons, I have quite another opinion entirely regarding exiting all longs and even shorting. Either way, and regardless of how you trade them, the setups themselves are crystal clear.


Back to homepage

Leave a comment

Leave a comment