


| Current Level | 5 Days | 1 Year | 5 Year | |
| Gold | 419.70 | -1.4% | +12.1% | +52.3% |
| Silver | 6.91 | 0.0% | +23.4% | +38.2% |
| S&P | 1,154.05 | -1.5% | +5.3% | -18.3% |
| Nasdaq | 1,976.78 | +0.5% | +2.6% | -44.9% |
| ISEQ | 6,028.33 | -0.3% | +16.2% | +11.5% |
| FTSE | 4,886.50 | -0.7% | +9.7% | -20.2% |
| EUR/USD | 0.79 | +2.0% | -7.0% | -28.6% |
| OIL (Nymex) | 48.67 | -4.5% | +18.5% | +69.9% |

Gold Investments have been appointed Approved Dealer for the Perth Mint Certificate Programme. The PMCP is the world's only government-guaranteed precious metal certificate programme. The Perth Mint is wholly owned by the government of Western Australia which is rated AAA by the US International Credit Rating Agency, Standard and Poor's.
Weekly Markets
It was another volatile week in the markets with concerns about losses at large head funds being to the fore on Wall Street.
Stock markets were largely down for the week.
Interest-rate markets were also unsettled and fears regarding the hedge fund issue may have resulted in a 'flight to quality' with bond prices rising and a subsequent drop in yields.
Commodities and precious metals were largely down with oil down significantly.
Precious Metals
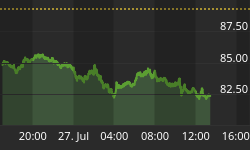
Gold was down by $6 or 1.41% for the week. From $425.70 to $419.70 per ounce.
Silver was unchanged for the week remaining at $6.91 per ounce.
Platinum (July) was largely unchanged, finishing at $865 from $867 per ounce
Palladium (June) was down 2.7% from $193.80 to $188.50 per ounce.
Gold's small drop was attributed to the recent strength of the dollar which continued it's rally. James Moore of TheBullionDesk.com said that "Strong US data put another twist on the precious metals thumbscrew." Reflecting this Moore believes there is little reason to think gold has anywhere to go but lower in the short term. "I think we could now see gold head down to $415 and potentially retest the year's lows around $410," he said. Important questions over the fundamentals of the US economy and the trade deficit or likely to provide support at these levels.
In the short term gold has suffered some technical damage and may even test support at the psychologically important $400 mark. It may need to consolidate at these levels prior to resuming the 5 year bull market. Of major importance is the continuing robust demand for physical gold globally.
The John Brimelow Report daily summarises the key findings of the major bullion banks and banks and commmodity houses which offer analysis on the precious metal markets. It is featured daily in Bill Murphy's Le Metropole Cafe. This week John reported how Indian ex-duty premiums: AM $5.65, PM $4.70, with world gold at $426.80 and $426.15. Taking all the Indian reporting cities as a whole. These premiums are high and more than ample for legal imports into India, the world's largest importer of gold bullion.
UBS said that "Demand for gold from our physical client base was strong over the past fortnight with good demand seen from India, the Middle East and, to a lesser extent Asia and Turkey . . . as soon as gold dropped below 423.50 in the June contract, stops hit the floor and gold traded to a low of 420.50 90. UBS bought a good amount of gold for physical customers and this helped support gold around 421.00." . . . "Very strong Asian physical demand has again been a factor preventing gold heading lower over the past few days"
Brimelow noted an upbeat Reuters story on physical demand: May 12 (Reuters) - Gold eased slightly in Asia on Thursday as the dollar firmed, but fresh buying interest from jewellers and investors helped it stay near New York's levels . . . "There's some good physical demand, mainly from our retailer customers in Malaysia and Vietnam," said Beh Hsia Wah, a dealer at United Overseas Bank in Singapore."
Mitsui-New York pointed out how "Indian physical demand has been enormous recently." The usually more bearish Commonwealth Bank of Australia were also upbeat on global physical demand "Good physical demand has emerged below USD425/oz repeatedly over the past month. Gold buyers appear to have adjusted to gold above USD420/oz over the past seven months. Asia, India, Turkey, and the Middle East are all providing good demand."
Going forward this global physical demand and the continuing decreasing supply in South Africa and globally should result in higher gold prices.
It is worth noting that gold has outperformed the stock market over the long term. Since the world came off the gold standard (officially August 15, 1971) and began trading freely it has increased from $35 to today's $420 for an increase of 1100%. The Dow Jones Industrials has increased from 856 to 10,140 for an increase of 1084%.
Thus gold has outperformed the Dow Jones Industrial Average over the long term despite the bear market in gold from 1980 to 1999 and the massive unprecedented bull market in stocks from 1982 to 1999. Despite taking on the added risk inherent in the stock market buyers of stocks have not been commensurately rewarded and indeed in recent years quite the opposite with gold up by more than 50% and the S&P 500 down some 20%.
For more on supply and demand factors and other fundamental reasons to consider saving or investing in gold please see our Weekly Commentary section.

Oil
Oil was again massively volatile and ended down more nearly 4.5%. The price for a barrel of oil fell as low as $47.75 before rebounding a bit and ending with a slight gain of $0.13 to $48.67. For the week, oil is down by $2.29.
In London, Brent North Sea crude for June delivery fell to $48.45 from $51.81.

Oil industry sees prices going higher - MENA Financial Network
OPEC still sings same old tune - Lazarus, San Francisco Chronicle
British Airways annual profit soars but warns of higher fuel costs - AFP
Oil and Food: A Rising Security Challenge - Earth Policy
Oil Doomsday is Nigh, Tar Sands Not a Substitute - Resource Investor
OTC: Analyst pushes plan for supply chain management - Oil & Gas Journal
Fourth Peak Oil Presentation by US Congressman Bartlett -US Congressional Record via Energy Bulletin
Rising fuel prices hit farmers with a 'three-way whammy' - Boston Globe
Higher fuel prices are 'inevitable' warns British Gas - Independent
British Gas warns of price rise - Telegraph
Wave, wind, sun and tide a powerful mix - Tickell, Guardian
Other Commodities
Reuters Commodities Research Bureau's Index was down 2.2% from 300.46 last Friday to 293.85.
The CRB's year to date gains are down to 3.5%. The 300 mark was important psychologically.
Since hitting a low of 182.83 in October 2001 it is up some 65%.
The Reuters CRB Index ( the 17 basic components include hard tangible assets such as Metals, Textiles and Fibers, Livestock and Products, Fats and Oils, Raw Industrials, Foodstuffs). One of the CRB index's greatest strengths is the fact that there is an equal weighting of all of its 17 components. This weighting assures that no price increase in any single commodity, like oil, can significantly skew the entire index. Significant moves in the CRB are only possible when the majority of its component commodities are moving in unison with a particular primary trend. Oil, silver and gold only account for 3/17th of the entire index.
The Goldman Sachs Commodities Index was down 1.7%. The GSCI is a world production-weighted commodity index which next year will be composed of 24 liquid exchange traded futures contracts. The GSCI includes energy, industrial metals, precious metals, agricultural and livestock products. It is up 11.9% year to date.
Base metals: Peter McGill of Bloomberg reported how "At Belgium's biggest railway station, 770 of 800 steel luggage carts have vanished. In Pittsburgh, 400 parking meters were plucked from roadsides, and in Shanghai, manhole covers are disappearing from the streets. From London to Kolkata, India, scavengers are plundering anything that contains iron, steel or copper, costing local governments and companies millions of dollars. Prices in the $85 billion global scrap market have tripled since 2003 as China has sucked in recycled metal from around the world. 'There is an almost insatiable global demand for scrap, mainly to feed China's steel mills and its booming economy,' says Rick Wilcox, director general of the British Metals Recycling Association . . ." Prices fell owing to the dollar's rebound and rumours of a production increase in China. Three-month copper fell to $3,048 per tonne from $3,170, aluminium to $1,741 from $1,778.50, nickel to $16,600 from $16,800, lead to $926 from $990, zinc to $1,237 from $1,254, and tin was unchanged at $8,150.
Rubber: Prices advanced on a continued absence of rain in major producer countries in Asia. On the Agricultural Futures Exchange of Thailand, the RSS3 June contract closed at 53.20 baht/kg, up 2.50 baht from a week earlier. In Osaka, the June contract rose to 148.50 US cents from 143.40. Singapore's June contract climbed to 134.50 US cents from 131.25 cents.
Cocoa: Futures steadied after reaching a 10-month low the previous week, but remained pressured by the prospect of a good harvest and reduced tensions in leading producer Ivory Coast. On the London International Financial Futures and Options Exchange (LIFFE), Cocoa for July advanced to 812 per tonne from 808. On the New York Coffee, Sugar and Cocoa Exchange (CSCE), the July contract slipped to $1,445 from $1,462.
Coffee: Prices firmed around five-year highs in London amid fears of colder temperatures in Brazil. On the LIFFE, Robusta quality for July increased to $1,130 per tonne from $1,112 a week earlier. On the CSCE, Arabica for July rose to 121.90 cents per pound from 121.70 cents.
Sugar: Prices fell slightly, with demand failing to match higher supply levels. On the LIFFE, a tonne of white sugar for August eased to $241.20 from $241.50 a week earlier. On the CSCE, a pound of unrefined sugar for July stood at 8.30 cents, down from 8.35 cents. (AFP)
Currencies
The US Dollar Index was up 1.8% for the week. It was up from 84.59 to 86.11.
The EUR was down by 1.52% or 1.95 cents for the week to close at 1.2627 from 1.2822. This is a 6 and ½ month low.
The YEN closed at 93.18 and is lower by 2.13 points or 2.23% on the week.
International currencies were largely down against the dollar for the week.
The Iceland krona sank 3.3%, the South African rand 3.3%, the Polish zloty 2.5%, and the New Zealand dollar 2.5%.
China further denied imminent plans for a Yuan revaluation as pressure by the US continues, though eventual revaluation is likely to happen sooner rather than later. The market will likely view this as dollar negative. Add to this recent comments from other major trading partners like Russia, South Korea, India, and Japan who all have expressed a desire to diversify their foreign reserves, which means they plan to hold or buy fewer U.S. dollars in the future.
Yuan Revaluation - TIME
Yuan Watching Like Waiting for Godot - Pesek, Bloomberg
Mobius: China currency revaluation a "safe bet" - The Edge Daily
One Asian currency? - Vatikiotis - International Herald Tribune
Bonds
The treasury and bond markets rallied on 'safe haven' buying with a consequent drop in yields.
The 10-Year Treasury note yield was down 12 basis points for the week to 4.14%.
Five-year Treasury yields were down 13 basis points, ending the week at 3.82%.
Two-year Treasury yields ended the week down 13 basis points to 3.59%.
Long-bond (30 year) yields dropped 14 basis points to 4.48%.
The spread between 2 and 30-year government yields declined from 91 to 89.
The hedge fund blow up caused a lot of market anxiety and may have continuing ramifications. The most current Settlements Data on Derivatives, assembled by the Bank of International (BIS) shows that there are now Exchange Traded Derivatives totalling some $279 trillion, and OTC derivatives now total $220 trillion. The total value of the US economy is some $10 trillion but the notional value of these derivatives is now nearly $500 trillion or half a quadrillion. The Sage of Omaha, Warren Buffet, has called these speculative instruments 'financial weapons of mass destruction'.
Timothy Geithner, the President of the New York Federal Reserve Bank, in an article in the FT, NY Fed warns of risk to structured credit. warned that while the "US financial system seems less vulnerable to financial specific shocks . . . Changes in the structure of the financial system and an increase in product complexity could make a crisis more difficult to manage and perhaps more damaging.... The growth of credit derivatives and other forms of risk transfer seem to have made the system more stable. But these gains may have come at the price of increasing uncertainty and potential losses if we end up in the 'tail'." [a bankers' term to describe the chance of a statistically rare event occurring.]"
It is worth remembering that statistically rare events while rare do occasionally happen. Non linear events such as the fall of the Berlin Wall, the Black Monday Stock Crash of October 1987, '911' and the Boxing Day Tsunami happen. More everyday examples of non-linear events are car crashes. One does not worry about the slight possibility of being in a car crash but nevertheless we are conscious that a car crash may happen at some time and we prepare for that eventuality. This is why we buy car insurance and do not consider it 'doomy or 'gloomy' to do so. Rather practical, sensible and prudent.
Similarly with gold - it is simply the most effective form of financial insurance as it is the only asset which is negatively correlated to the major asset classes and the only asset class which performs well during economic periods of deflation, high inflation and stagflation.
City hedge funds head for domino collapse - The Times, 16-05-05
Bracing for more tough times - CNN Money, 16-05-05
Markets nervous over rumors of hedge fund frailty - Taipei Times, 16-05-05
The Risk in Hiding Behind a Hedge - Los Angeles Times, 15-05-05
Let's play 'spot the joker' - the hedge fund version - Independent, 15-05-05
The week when hedge funds discovered they can't walk on water - Telegraph, 15-05-05
The Tick, Tick of GM in Hedge Fund Derivatives - Gilbert, Bloomberg, 13-05-05
Hedge fund jitters emerge, 7 years after big failure - AFP
Stocks
The stock markets were largely down but there was some strength in the tech sector.
The Dow Jones Industrial Average was down 205 points to 10,140; down 2% for the week after last weeks 1.5% rally.
The S&P 500 Index, of more significance than the DOW, was down 1.5% to 1154.
The Nasdaq Composite was up 0.48% for the week to 1976.8 after a late day rally on Friday.
The FTSE was down 0.7% and the ISEQ was down 0.3%.
There was a lot of churning, instability, volatility and atypical sector divergences.
More economically sensitive stock sectors sold off.
The Transports were down strongly by 3.5%.
Utilities were down 2.5%.
The Morgan Stanley Consumer index was down by 1%.
The Morgan Stanley Cyclical index was down by 4%.
The small cap Russell 2000 and S&P400 Mid-cap indices were both down some 2%.
The NASDAQ100 and the Morgan Stanley High Tech index were up 1% and 2% respectively.
The Semiconductors were up 3%.
The Street.com Internet Index and NASDAQ Telecommunications indices were flat and up 1% respectively.
Biotechs were up 1%.
More interest rate sensitive financial stocks were again mixed.
The Broker/Dealers were down fractionally but the Banks were down 1%.
The XAU Index of large precious metal mining stocks was down 7.8%.
The HUI (AMEX's Gold BUGS index) a basket of unhedged gold and silver stocks dropped 9% again showing the massive volatility in the precious metal stocks.
There has been a massive sell off in the precious metal mining stocks in recent weeks. At the end of 2003, the HUI was over 250 and the XAU over 110. Today precious metal prices are marginally higher and yet the gold and silver stocks are down by more than 35% to a HUI of 168 and a XAU of 79. This would suggest that either gold bullion is due for some short term weakness or the shares may be ready to rally again.
Other Credit and Money Supply Indicators
Broad money supply (M3) declined $14.5 billion to $9.59 Trillion (week of May 2). Year-to-date, M3 has expanded at a 3.6% rate, with M3-less Money Funds growing at 5.7% pace. For the week, Currency added $0.4 billion. Demand & Checkable Deposits dropped $9.9 billion. Savings Deposits gained $5.5 billion. Small Denominated Deposits rose $4.0 billion. Retail Money Fund deposits declined $1.0 billion, and Institutional Money Fund deposits fell $1.3 billion. Large Denominated Deposits dropped $8.7 billion. For the week, Repurchase Agreements declined $1.6 billion, and Eurodollar deposits decreased $1.9 billion.
Bank Credit expanded $9.6 billion last week, increasing the year-to-date expansion to $324 billion, or 13.9% annualized. Securities Credit is up $117 billion, or 17.7% annualized, year-to-date. Loans & Leases have expanded at a 12.2% pace so far during 2005. For the week, Securities jumped $17.1 billion. Commercial & Industrial (C&I) loans declined $4.0 billion. Real Estate loans rose $3.4 billion. Real Estate loans have expanded at a 14.6% rate during the first 18 weeks of 2005 to $2.667 Trillion. Real Estate loans are up $302 billion, or 12.7%, over the past 52 weeks. For the week, consumer loans dropped $7.9 billion, while Securities loans added $2.6 billion. Other loans dipped $1.6 billion.
Total Commercial Paper jumped $13.1 billion last week ($68.4bn in 6 wks) to $1.498 Trillion. Total CP has expanded at a blistering 16.3% rate y-t-d (up 12.2% over the past 52 weeks). Financial CP surged $12.4 billion last week to $1.349 Trillion, with a y-t-d gain of $84 billion (13.8% ann.). Non-financial CP added $0.7 billion to $148.7 billion (up 30.3% in 52 wks).
Fed Foreign Holdings of Treasury, Agency Debt increased $0.4 billion to $1.40 Trillion for the week ended May 11. "Custody" holdings are up $63.6 billion, or 13.8% annualized, year-to-date (up $207bn, or 17.3%, over 52 weeks). Federal Reserve Credit declined $3.2 billion to $783.3 billion. Fed Credit has declined 2.5% annualized y-t-d (up $41.9bn, or 5.7%, over 52 weeks).
ABS issuance was a solid $13 billion (from JPMorgan). Year-to-date issuance of $233 billion is 14% ahead of comparable 2004. At $150 billion, y-t-d home equity ABS issuance is 24% above the year ago level. (Noland, Prudent Bear)
Commentary
Fundamental Reasons to Invest and Save in Gold & Silver
Demand Fundamentals - Increasing Global Demand
Demand for physical gold continues at near-record highs around the world. The only aspect of gold demand which has not reached record highs is western investment demand although this too is on the increase. When macroeconomic conditions bring investors back to gold, they will be confronted by a very tight market.
These investors in the western world will be joined by significant increase in demand from large elements of the developing and semi-developed world, such as China, Russia, Brazil, Argentina, India, Indonesia and the Islamic world.
The gold market was recently liberalised in China. Gold is deeply rooted in the psyche of the Chinese people due to their experience of totalitarian government and other reasons. For the first time in 50 years Chinese individuals can buy, save and invest in gold. The gold market has been liberalised and the burgeoning financial centre that is Shanghai now has the Shanghai Gold Exchange. It is to be the first of a number of gold exchanges in China's major cities. The Shanghai Gold Exchange has authorized the China Bank, China Industrial & Commercial Bank, China Constructional Bank and China Agricultural Bank as the banks for settling accounts. The commodities traded are "9999" one-kilo gold bullion and "9995" three-kilo gold bullion.
 A customer consults information on investing in gold bars at a China Merchants Bank (CMB) outlet in Beijing yesterday. Beijingers can now buy and sell gold bars through the bank, which said the new investment tool might help individual investors manage their assets. CMB said it had launched the repurchasable gold-bar business in the capital city and plans to extend it to Shenzhen. A step-by-step national roll-out is expected to follow.
Gold is both a symbol of wealth in China and considered a means to increase and preserve one's families wealth. It is also a symbol of good fortune and has always had a special place in the hearts and minds of all Chinese people - young and old, rich and poor. Chinese individuals and companies can invest in gold for the first time since 1949. The population of China and the Chinese diaspora is some 1.3 billion people.
Increasingly large elements of the disgruntled Islamic World are seeking ways to diversify out of U.S. dollar denominated assets and OPEC and other oil producing nations have spoken openly about charging for their oil in euros rather than in dollars which are rapidly losing their value. Mohammed Mathathir, the ex-Prime Minister of Malaysia and greatly respected in the Islamic world has mooted the possibility of Arabic countries charging for their oil in gold. He is also a strong proponent of an Islamic Dinar or an Islamic currency backed by gold to counteract what he and increasingly much of the Arab World, sees as U.S. economic and military hegemony and in order to stop international financial speculation from destroying the fiat currencies of weaker nations.
In Russia, President Putin and senior officials in the Russian Central Bank have gone on record, like many Central Banks worldwide, as to be actively selling their dollar reserves and replacing them by buying euros and gold. This process is likely to continue giving the deteriorating relations between the US and Russia.
India is at the moment the world's largest importer and consumer of gold. It's gold market, like it's Chinese counterpart was liberalised and deregulated in the mid 1990's. Gold controls constituted an effective total ban on imports of gold into the country, together with all sorts of other regulations that restricted private ownership of gold severely. The Indian economy is booming and the rupee is becoming much stronger facilitating even greater imports of gold.
The reasons, listed above, motivating these significant political and economic powers to diversify their assets out of dollar denominated assets and into gold are also influencing many other countries around the world and will eventually lead to greater investment demand in the western world by both individuals, companies, financial institutions and Central Banks with a consequent significant impact on the price of gold.
Supply Fundamentals - Decreasing Global Supply
The physical gold market is very tight. For an entire decade, demand for gold has outpaced new supplies. The low gold prices of the past few years have only contributed to the situation as the price of an ounce of gold had fallen below the cost to produce that ounce of gold in many parts of the world. As a result, thousands of miners were laid off, particularly in South Africa, and numerous mines have been closed. Moreover, exploration had ground to a halt. Less exploration and lower future production, coupled with curtailed central bank sales and probable central bank purchases of gold, will make a tight market even tighter down the road.
There is an increasing gap between gold and silver mine supply and total global demand. Silver mine supply is 590 million ounces and total global demand is 900 million ounces, the bulk of the gap is met through recycling.
The World Gold Council reports second successive quarter of strong consumer demand, as consumer demand rose by 11% in tonnage terms, and 25% in dollar terms, compared to a year earlier. Gold Field Mineral Services have compiled data showing that total gold supply in the first quarter of 2004 would be around 791 tonnes and total gold demand is 838 tonnes or a deficit of 48 tonnes. This supply deficit was expected to widen in the second quarter of 2004, with total gold supply of 820 tonnes and total gold demand of 913 tonnes or a deficit of 93 tonnes.
These supply/demand deficits are continuing and are expected to widen in the coming years and this will likely result in higher gold prices.
Gold is Undervalued
Gold has been trading between $340 and $455 or EUR300 and EUR350 per ounce for the last year. The following figures put the current price of gold in historical perspective:
From 1979 to 1999, the Average Annual Low for the price of gold was $340 per ounce.
From 1979 to 1999, the Average Annual price of gold was $386 per ounce.
From 1979 to 1999, the Average Annual High for the price of gold was $455 per ounce.
In 15 out of the last 20 years, gold exceeded $400 per ounce.
The price of gold is actually trading at less than half of its all-time high of $890 in 1980 and around one quarter of it's all time high of $1,590, adjusted for the significant inflation of the last 24 years.

The US Dollar has fundamental structural problems
The price of gold languished under the weight of a strong U.S. dollar at the end of the 1990's. Because the dollar is the world's reserve currency and gold is priced in dollars, a strong dollar tends to depress the price of gold. It also attracts investors to U.S. stocks and bonds, particularly Treasuries. With the U.S.' huge trade deficit, growing oil imports, and increasingly volatile stock market, the dollar could lose even more of it's value in the coming months. Should the dollar's decline be sustained, gold will benefit on two fronts. First, because gold is priced in dollars, as the value of the dollar declines, the price of gold will tend to increase. Second, as the value of the dollar declines, foreign investment in U.S. stocks and bonds will decline, adding to the negative momentum in those markets. This will indirectly boost investment demand for gold.
Rising Interest Rates
Alan Greenspan and the Federal Reserve have now raised interest rates 8 times in a row. This will create a climate in which stocks and bonds will find it difficult to do well. History has shown that rising interest rates often coincide with rising gold prices as was shown in the 1970's.

Uncertainty in Stock Markets
Stock markets from London to New York to Tokyo have bounced back a bit in recent months. Yet there are still lingering questions about high stock valuations, indicating the market may have further to fall. Should this prove to be a long bear market rally rather than a genuine end to the three year bear market, more and more investors will look for alternative assets, such as gold and silver. Gold's correlation with stocks has historically ranged from nil to negative, meaning it moves in the opposite direction to stocks and indeed property. Therefore it provides very effective diversification of a stock or property portfolio.

Increasing Inflation and Stagflation
Federal Reserve is attempting to walk a tightrope of preventing deflation by creating inflation. However, once inflation is created it is difficult to control and may necessitate a rise in interest rates which could suffocate the tentative signs of recovery in the U.S. economy. Oil prices have quadrupled over the past 18 months and have recently greatly surpassed their all time highs in the oil crisis of 1980. Almost every commodity index has been on the rise as indicated by the huge increase in the CRB index or basket of commodities index. The combination of a tight labour market and rising raw materials prices has not occurred since the 1970s. If inflation continues to build, stocks and bonds will suffer, while traditional inflation hedges, such as gold, will appreciate in value.
Reversion to the Mean
Since 1970, gold has predominantly moved in the opposite direction of stocks. History also shows that the prices of both stocks and gold tend to revert to the mean over the long term. A crucial question then arises. When will equities move down to their mean, and when will gold move up? How much would gold have to rise to get to the mean? From 1979 to 1999, the average annual price of gold was $396 per ounce. From 1979 until 1999, the average annual price of the Dow Jones is around 2,500 or less than 25% of the Dow's current price.


Rising Oil and Commodity Prices
Commodity prices have been on the rise for months, but gold has not kept pace. Base metals, raw materials and energy prices are all up. Gold prices have been lagging slightly. History has shown that a wide disparity between commodity prices and gold does not persist for long. The price of oil has tripled over the past year and a half and has surpassed it's all time highs of 1980. In the final analysis, a significant, sustained rise in oil prices is likely to exert an upward pull on gold prices. An oil price rise also tends to increase inflation. The two major upward moves in the price of oil in the 1970's were accompanied by increases in the price of gold to its peak of $890 an ounce in 1980.

World Geopolitical Tensions
The continuing problems in the Middle East and the 'War on Terror' may have serious effects on the U.S. and global economy by hitting consumer and investor confidence. While the 'War on Terror' has been beneficial to the U.S. economy in the short term by allowing President Bush to spend billions on both the Afghanistan and Iraqi wars and on 'Homeland Security' thereby creating massive liquidity and what some have called corporate welfare to favoured corporations. These 'guns and butter' policies create short-term spurts of stimulus but are unsustainable and only lead to the creation of long term government deficits, higher interest rates and higher taxes.
America's Burgeoning Trade Deficit The U.S. has an often overlooked, serious and troubling trade deficit. The gap between America's imports and exports is running at $55bn+ each and every month or more than $600 billion per year. This trade deficit is approaching unsustainable levels and no one knows for sure what the effects might be. This deficit could potentially lead to a US protectionist backlash and consequently, foreign, particularly Chinese, dumping of U.S. Treasury Bonds and consequent raise in interest rates, foreign dumping of other U.S. securities, and or a sharp decline in the dollar. Gold would perform as a hedge against any of these three scenarios.
America's Growing Consumer, Corporate, State and National Debt
America's debt levels are reaching all-time highs; perhaps unsustainable highs that could wreck the "Goldilocks" economy. Revolving (credit card) debt is at an all-time high. Home equity is actually down, despite the rise in home ownership. Bankruptcies are being filed at a record pace. Some 37% of all money in 401(k) plans has been borrowed against. Nearly 48% of American families spend more than they earn each year. The average household carries more than $19,000 in debt - excluding mortgages.
President Bush admitted in his 2004 'State of the Union' address that US government debt will hit $521bn this year alone. The total could run to $2.4 trillion by 2014 - almost 50% up on his last estimate. All of this debt may spell trouble for the stock market and the wider economy in the near future and at the very least it should make one cautious about the long term health of the US economy.
US Government Budget Surplus / Deficit 1972 - 2002
Source: Congressional Budget Office, Chart by Marianna Quenemoen.

Opinions of the Week
"The US financial system seems less vulnerable to financial specific shocks . . . Changes in the structure of the financial system and an increase in product complexity could make a crisis more difficult to manage and perhaps more damaging.... The growth of credit derivatives and other forms of risk transfer seem to have made the system more stable. But these gains may have come at the price of increasing uncertainty and potential losses if we end up in the 'tail'." [a bankers' term to describe the chance of a statistically rare event occurring.]"
Timothy Geithner, President of the New York Federal Reserve Bank, NY Fed warns of risk to structured credit, FT
"Careless journalists and commentators are hyping the 274,000 new April payroll jobs as evidence of the health of the US economy. An examination of the details of the new jobs puts a different view on the matter. April's job growth is consistent with the depressing pattern of US employment growth in the 21st century: The outsourced US economy can create jobs only in domestic nontradable services.... Americans regard themselves as "the world's only superpower," but the pattern of American job growth in the 21st century is that of a third world economy.... China and India are winning. America is losing. It is as simple as that."
Paul Craig Roberts, Assistant Secretary of the Treasury in the Reagan Administration & Ex-Associate Editor of the Wall Street Journal, America is Losing - More Phony Jobs Hype, Counter Punch
"If the worst fears about a possible recession are confirmed, then the bank would of course cut interest rates. But if the present calm in the bank about the oil price were to be shattered by a catastrophe in the Middle East, and another sharp rise in the price of oil, then those fears of stagflation might well be realised."
William Keegan, Can Bank of England keep stagflation at bay?, The Guardian, 15-05-05
"It was bound to happen. Cycles of fear and greed are as old as financial markets themselves. When asset prices go to excess, we always hear the same refrain, "This time it's different." That was the spin on tulips in the 17th century, equities in the summer of 1987, the Nikkei in 1989, fixed income markets in 1993, and, of course, Nasdaq in 2000. Chastened by the inevitable post-bubble carnage, speculators, regulators, and policy makers always promise, "Never again." Yet memories are short, and as day follows night, so do cycles of greed and fear - and the proverbial next time. Such is the case with the wrenching unwinding that is now occurring in a broad array of so-called structured credit products. The possibility of contagion to other spread markets - namely, high-yield and emerging-market debt, as well as investment-grade corporates - cannot be ruled out. In my view, that could well open up a serious fault line in America's asset-dependent economy.
As always, the real problem with excess leverage is that there is never good knowledge as to who is most vulnerable in the event of a reversal in market conditions. Painful as they are, market corrections serve the useful purpose of revealing misalignments in both asset pricing and asset allocation of the investor base. While attention has been focused in recent days on hedge funds and other institutional investors, I am more worried about the American consumer. The increased dispersion of risk among institutional investors would certainly tend to mitigate the possibility of single-name breakage as was the case back in 1998 with the demise of Long Term Capital Management. Usually, it's the least-experienced borrower or lender that suffers the greatest damage in a market correction. In my mind, that puts the income-short, saving-short, overly indebted, asset-dependent American consumer at the top of the watch list. As always, we won't know where the rocks are until the tide goes out."
Stephen Roach, Global: Low Tide, Chief Economist, Morgan Stanley, 15-05-05
"The present era has no comparable referent in the past history of capitalism. We have a higher percentage of the intelligentsia engaged in buying and selling pieces of paper and promoting trading activity than in any past era. A lot of what I see now reminds me of Sodom and Gomorrah. You get activity feeding on itself, envy and imitation. It has happened in the past that there came bad consequences."
Charlie Munger, Berkshire Hathaway
"An even more ominous factor which is adding to the Fed's difficult policy choices is the ballooning US external current account deficit. At 6.25 per cent of GDP, the present current account deficit has no precedent in US economic history. This deficit will only widen in the period ahead given the more rapid economic growth that might be expected of the US than of Europe and Japan.
More disturbing still is the fact that more than half of the current account deficit is being financed by foreign central banks, which have already accumulated close to $US2 trillion ($2.6 trillion) in US Treasury bonds. Greenspan's nightmare scenario has to be a significant loss of appetite by foreign central banks for US Treasury paper.
In such an event, the US dollar could be expected to swoon, while long-term Treasury yields would be forced up for want of buyers. It is for this reason that Greenspan keeps exhorting Congress to mend its profligate fiscal ways and to play its part in weaning the US from an overdependence on external savings.
All too sadly, Greenspan's exhortations to Congress are falling on deaf ears. This is prompting Paul Volcker, Greenspan's illustrious predecessor, to publicly muse about a global economy that is skating on thin ice.
Hopefully, Congress will mend its ways before it is too late for both the US and the global economies. "
Desmond Lachman, Politicians Deaf to Greenspan's Fiscal Warnings, American Enterprise Institute
"Every era of financial bubbles is eventually followed by a severe credit contraction. Since the advent of modern financial markets by around 1700, there have been five examples prior to the blowout in 1Q2000. Also typically, the post-bubble rise in gold ran for 20+ years. With varying degrees of intensity and success, the record is complete back to the 1690s' depression bottom, which recorded the 'Oro Preto' mania in Brazil.... Bull markets in commodities typically run for more than 20 years and they start from a depression bottom and end in the era of bubbles.... "This recovery in stocks, business, and credit markets is showing some of the classic signs of topping at the same time as the gold side of the equation is indicating downside capitulation. In which case, the second cyclical bull market, whereby gold will outperform most commodities as well as most financial assets, is about to get underway."
Bob Hoye, Gold: Contra - Cyclical Opportunity?, Institutional Advisors
"How to return the United States to fiscal sanity and economic health.
The United States has tremendous economic strengths but it also faces great challenges: the need to ensure national security; a newly competitive China and India; serious shortcomings in public education, basic research, infrastructure and other requisites for meeting that competition; and much else. An immediate and critical imperative is to redress fiscal imbalances.
Most pressing is the 10-year federal deficit, which most independent analysts project at $4.5 trillion to $5 trillion, assuming that the tax cuts passed in 2001 and 2003 are made permanent and that the alternative minimum tax is adjusted to avoid unintended effects on middle-income taxpayers. And while 10-year numbers can be highly unreliable, deficits are as likely to be higher as to be lower. Over the longer term, Social Security has a 75-year estimated deficit of $4 trillion, while the different components of Medicare, including its new prescription drug benefit, represent a fiscal problem of roughly $20 trillion. Virtually all mainstream economists agree that, over time, sustained deficits crowd out private investment, increase interest rates, and reduce productivity and economic growth. But, far more dangerously, if markets here and abroad begin to fear long-term fiscal disarray and our related trade imbalances, those markets could then demand sharply higher interest rates for providing long-term debt capital and could put abrupt and sharp downward pressure on the dollar. These market effects, plus the adverse impact of continuing fiscal imbalances on business and consumer confidence, could seriously undermine our economy. We have managed to avoid these market effects so far because private demand for capital has been relatively limited, and because the central banks of Japan, China and other countries have provided large inflows of foreign capital. A change in either of those circumstances, or simply a change of market psychology for whatever reason, could, however, turn these interest rate and currency risks into a reality."
Robert Rubin, Treasury Secretary from 1995 to 1999, is a Director of Citigroup, Attention: Deficit Disorder, New York Times, 13-05-05
Opinions and Quotes can be found in articles in the Daily News and Commentary sections of www.gold.ie.
Key economic reports in the week ahead
The NY Empire State Index, due Monday, is expected to have risen to 11.0 in May, according to a consensus of economists surveyed by Briefing.com. The regional read on manufacturing stood at 3.1 in April.
Two reads on the housing sector are due Tuesday. Housing starts are expected to have climbed to a 1.98 million unit annual rate in April from a 1.837 million unit annual rate in March. Building permits are expected to have grown to a 2.043 million unit annual rate in the month from a 2.023 million unit annual rate in February.
The Producer Price Index (PPI), due Tuesday, is expected to have increased 0.4 percent in April after a 0.7 percent hike in March. The so-called "core" PPI, which excludes volatile food and energy prices, is expected to have been up 0.2 percent after gaining 0.1 percent in March.
The Consumer Price Index (CPI), due Wednesday, is forecast to be 0.4 percent higher in April after advancing 0.6 percent in March. The "core" CPI is seen posting a 0.2 percent boost after rising 0.4 percent in March.
The read on leading economic indicators (LEI) due Friday, is expected to have declined 0.2 percent in April. The index fell 0.4 percent in March.
The Philadelphia Fed index, a regional read on manufacturing, is also due Friday. The index is expected to have slipped to 19.0 in May from 25.3 in April.


