SPY
Last week's article I left readers with the idea of looking for a bounce for wave [iv] and new lows for wave [v].
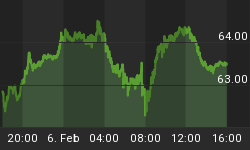
We got the bounce for wave [iv], although smaller than I initially thought, but the spike lower off the FED minutes appears to have completed the smaller wave [v]. The bounce off the lows is exactly what the bulls wanted to see, so it appears that it is now correcting the 5 wave decline from 171.
Earlier in the week I was watching the NYSE McClellan Osc for clues, I noticed the readings were back to levels where a strong bounces have come. This further suggested a bounce was likely due. So caution was needed. That caution proved to be a wise step.

The current reading is just under 0. It's bounced a decent amount, so good grounds for a breather, for a day or two.
We should see a small pullback early next week for a small [b] wave, to around 165 (in 3 waves), then that should setup for more upside in wave [c] of [ii] to around the 168 area, there is an open gap which could serve as a target around the 1685SPX area. So I suspect the market may target that area over the coming week ahead.
An alternative idea is that Fridays bounce ended wave [iv] as part of a complex wave [iv] and then we see a test of the lows made this past week, however I would need to see a strong break of 165 to get behind that area, I prefer the idea in black and any weakness next week will likely find support around the 165 area.
As long as any bounce is in 3 waves and fails to exceed the highs at 171, I am expecting more downside over the coming months ahead, as part of a larger correction that will target the 1500-1530 on the SPX.
NYSE
Another market that is supportive of the market putting in a 5 wave decline is the NYSE.
I am looking for the same 3 wave bounce to correct the 5 wave decline, so potentially target the gap fill above or get close to it, but we will adjust as the markets dictates.
So early next week, any weakness that appears to be corrective would setup a buying opportunity for the bulls and target another 30-35 points on the SPX.
Until next time,
Have a profitable week ahead.


