• 777 days Will The ECB Continue To Hike Rates?
  • 778 days Forbes: Aramco Remains Largest Company In The Middle East
  • 779 days Caltech Scientists Succesfully Beam Back Solar Power From Space
  • 1,179 days Could Crypto Overtake Traditional Investment?
  • 1,184 days Americans Still Quitting Jobs At Record Pace
  • 1,186 days FinTech Startups Tapping VC Money for ‘Immigrant Banking’
  • 1,189 days Is The Dollar Too Strong?
  • 1,189 days Big Tech Disappoints Investors on Earnings Calls
  • 1,190 days Fear And Celebration On Twitter as Musk Takes The Reins
  • 1,192 days China Is Quietly Trying To Distance Itself From Russia
  • 1,192 days Tech and Internet Giants’ Earnings In Focus After Netflix’s Stinker
  • 1,196 days Crypto Investors Won Big In 2021
  • 1,196 days The ‘Metaverse’ Economy Could be Worth $13 Trillion By 2030
  • 1,197 days Food Prices Are Skyrocketing As Putin’s War Persists
  • 1,199 days Pentagon Resignations Illustrate Our ‘Commercial’ Defense Dilemma
  • 1,200 days US Banks Shrug off Nearly $15 Billion In Russian Write-Offs
  • 1,203 days Cannabis Stocks in Holding Pattern Despite Positive Momentum
  • 1,204 days Is Musk A Bastion Of Free Speech Or Will His Absolutist Stance Backfire?
  • 1,204 days Two ETFs That Could Hedge Against Extreme Market Volatility
  • 1,206 days Are NFTs About To Take Over Gaming?
How The Ultra-Wealthy Are Using Art To Dodge Taxes

How The Ultra-Wealthy Are Using Art To Dodge Taxes

More freeports open around the…

Another Retail Giant Bites The Dust

Another Retail Giant Bites The Dust

Forever 21 filed for Chapter…

Is The Bull Market On Its Last Legs?

Is The Bull Market On Its Last Legs?

This aging bull market may…

  1. Home
  2. Markets
  3. Other

SILVER Elliott Wave Technical Analysis

Originally posted 26th September, 2013.

Last analysis expected upwards movement for Silver. The target was 26.09.

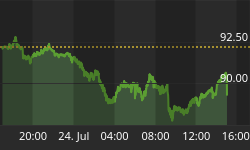
Price moved upwards and was 2.673 short of the target. It made a new high, then turned lower, and has been moving sideways for four days.

Downwards movement looks like a typically deep second wave correction. Price remains above the invalidation point on the hourly chart.

Silver Daily Chart
Larger Image

A downwards zigzag is unfolding at primary wave degree. Within the zigzag intermediate wave (A) is complete. Intermediate wave (B) is an incomplete zigzag.

Within minor wave B the structure may be an almost complete zigzag, or this may only be minute wave a of a flat or double for minor wave B.

At 28.121 minor wave C would reach equality with minor wave A.

Within minor wave C no second wave correction may move beyond the start of the first wave. This wave count is invalidated with movement below 21.216.

Silver Hourly Chart
Larger Image

Sideways movement for the last four days looks like a combination or double flat unfolding. It would be incomplete; one more final small wave down should complete it.

At this stage the combination looks like a double. When this second structure labeled subminuette wave y is completed the probability that the correction is complete will be extremely high. The only way it could continue would be as a very rare triple.

At 24.55 minute wave iii would reach 1.618 the length of minute wave i. This target should be about 5 to 8 days away.

Minuette wave (ii) within minute wave iii may not move beyond the start of minuette wave (i). This wave count is invalidated with movement below 21.291.


Back to homepage

Leave a comment

Leave a comment