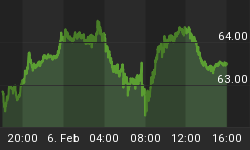
USD is sharply down across the board after the US government shutdown. Some would think that US stocks futures will turn lower, but we in fact can see higher prices since the news came out. However, we may see a risk aversion (lower stocks) if government will be shutdown for too long, lets say around 3 weeks. In the past the longest close was 21 days, back in 1995 (source Wikipedia). The longer the shutdown will last, more nervous investors will become.
From a technical point of view we see room for more USD weakness as long as market trades beneath 80.75. Meanwhile of course we expect higher majors, such as EUR, GBP, CHF and even AUD which is also bullish and supported fundamentally after RBA kept rates unchanged at 2.5%.
USD Index daily

On the AUDUSD chart we can see that pair found a support around 0.9220-0.9300 area, at former wave four from where we have seen a nice bullish reversal with a decisive break through the upper trend-line of a corrective channel (circled zone). This break indicates an uptrend continuation for AUDUSD that is now pointing back towards 0.9528. Force index is also reversing higher now suggesting that volume and momentum are coming back into the market.
AUDUSD 4hElliott Wave Analysis Chart

In fact, notice that latest decline on AUDUSD was in three legs, labeled as A-B-C. This is a structure of a contra-trend price action, called a zigzag. When zigzag is complete, the pull-back will normally be fully retraced.
With that said, we expect more upside on AUDUSD.
Written by www.ew-forecast.com | Try EW-Forecast.com's Services Free For 7 Days at http://www.ew-forecast.com/service


