• 1,016 days Will The ECB Continue To Hike Rates?
  • 1,017 days Forbes: Aramco Remains Largest Company In The Middle East
  • 1,019 days Caltech Scientists Succesfully Beam Back Solar Power From Space
  • 1,418 days Could Crypto Overtake Traditional Investment?
  • 1,423 days Americans Still Quitting Jobs At Record Pace
  • 1,425 days FinTech Startups Tapping VC Money for ‘Immigrant Banking’
  • 1,428 days Is The Dollar Too Strong?
  • 1,428 days Big Tech Disappoints Investors on Earnings Calls
  • 1,429 days Fear And Celebration On Twitter as Musk Takes The Reins
  • 1,431 days China Is Quietly Trying To Distance Itself From Russia
  • 1,431 days Tech and Internet Giants’ Earnings In Focus After Netflix’s Stinker
  • 1,435 days Crypto Investors Won Big In 2021
  • 1,435 days The ‘Metaverse’ Economy Could be Worth $13 Trillion By 2030
  • 1,436 days Food Prices Are Skyrocketing As Putin’s War Persists
  • 1,438 days Pentagon Resignations Illustrate Our ‘Commercial’ Defense Dilemma
  • 1,439 days US Banks Shrug off Nearly $15 Billion In Russian Write-Offs
  • 1,442 days Cannabis Stocks in Holding Pattern Despite Positive Momentum
  • 1,443 days Is Musk A Bastion Of Free Speech Or Will His Absolutist Stance Backfire?
  • 1,443 days Two ETFs That Could Hedge Against Extreme Market Volatility
  • 1,445 days Are NFTs About To Take Over Gaming?
What's Behind The Global EV Sales Slowdown?

What's Behind The Global EV Sales Slowdown?

An economic slowdown in many…

Is The Bull Market On Its Last Legs?

Is The Bull Market On Its Last Legs?

This aging bull market may…

readtheticker

readtheticker

readtheticker

We are financial market enthusiasts using methods expressed by the Gann, Hurst and Wyckoff with a few of our own proprietary tools. Readtheticker.com provides online…

Contact Author

  1. Home
  2. Markets
  3. Other

When Does A Stock Have The Correct Pattern?

You often here folks on TV saying the chart does look good, it needs more time. So what are they talking about. Well let's put your mind at rest.

The simple pattern is 'steps'. Price action climbing up and over resistance during a bullish phase. If the chart reader can not determine the stepping nature in the chart then simply the reader is lost in the trees and cant see the forest. If the professional cant see the step formation than of course they say 'the chart is not right!'. Easy peasy!2 2

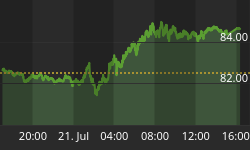
Here is a classic example.


Larger Image

Analysis of the steps requires a deep understanding if Richard Wyckoff logic. Here is a good place to start.

Investing Quote...

"The Tape Reader's profits should develop naturally. He should buy or sell because it is the thing to do - not because he wants to make a profit or fears to make a loss" ~ Richard D. Wyckoff

"The four most dangerous words in investing are 'This time it's different' " ~ John Templeton


Back to homepage

Leave a comment

Leave a comment