• 1,053 days Will The ECB Continue To Hike Rates?
  • 1,053 days Forbes: Aramco Remains Largest Company In The Middle East
  • 1,055 days Caltech Scientists Succesfully Beam Back Solar Power From Space
  • 1,455 days Could Crypto Overtake Traditional Investment?
  • 1,460 days Americans Still Quitting Jobs At Record Pace
  • 1,462 days FinTech Startups Tapping VC Money for ‘Immigrant Banking’
  • 1,465 days Is The Dollar Too Strong?
  • 1,465 days Big Tech Disappoints Investors on Earnings Calls
  • 1,466 days Fear And Celebration On Twitter as Musk Takes The Reins
  • 1,468 days China Is Quietly Trying To Distance Itself From Russia
  • 1,468 days Tech and Internet Giants’ Earnings In Focus After Netflix’s Stinker
  • 1,472 days Crypto Investors Won Big In 2021
  • 1,472 days The ‘Metaverse’ Economy Could be Worth $13 Trillion By 2030
  • 1,473 days Food Prices Are Skyrocketing As Putin’s War Persists
  • 1,475 days Pentagon Resignations Illustrate Our ‘Commercial’ Defense Dilemma
  • 1,476 days US Banks Shrug off Nearly $15 Billion In Russian Write-Offs
  • 1,479 days Cannabis Stocks in Holding Pattern Despite Positive Momentum
  • 1,480 days Is Musk A Bastion Of Free Speech Or Will His Absolutist Stance Backfire?
  • 1,480 days Two ETFs That Could Hedge Against Extreme Market Volatility
  • 1,482 days Are NFTs About To Take Over Gaming?
Another Retail Giant Bites The Dust

Another Retail Giant Bites The Dust

Forever 21 filed for Chapter…

Market Sentiment At Its Lowest In 10 Months

Market Sentiment At Its Lowest In 10 Months

Stocks sold off last week…

  1. Home
  2. Markets
  3. Other

USDJPY Elliott Wave Analysis: 4-Month Triangle Could Be Near Completion

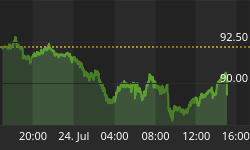
USDJPY is trapped in tight range for around four months now which could be at the end if we consider an Elliott Wave triangle pattern that is pointing higher. The reason is a move in five legs, labeled as A-B-C-D-E, which suggests that pattern is near completion. In fact, we have seen a sharp reversal last week from 61.8% Fibonacci support compared to wave C) distance which is usually a stopping point for E) waves. As such, we suspect that prices will rally in days ahead, this time towards and ideally through 100.50 mark that will put bullish price action in play for a new high of the year on USDJPY.

USDJPY Daily

USD/JPY Daily Chart


Educational Part: Elliott Wave Triangle Pattern

A Triangle is a common 5 wave pattern labeled A-B-C-D-E that moves counter-trend and is corrective in nature. Triangles move within two channel lines drawn from waves A to C, and from waves B to D. A Triangle is either contracting or expanding depending on whether the channel lines are converging or expanding. Triangles are overlapping five wave affairs that subdivide 3-3-3-3-3.

Contracting triangle

Idealized Elliott Wave Contracting Triangle Chart

• Structure is 3-3-3-3-3
• Each subwave of a triangle is ussaly a zig-zag
• Wave E must end in the price territory of wave A
• One subwave of a triangle usually has a much more complex structure than others subwaves
• Appears in wave four in an impulse, wave B in an A-B-C, wave X or wave Y in a double threes, wave X or wave Z in a triple threes


Written by www.ew-forecast.com | Try EW-Forecast.com's Services Free For 7 Days >>> Here


Back to homepage

Leave a comment

Leave a comment