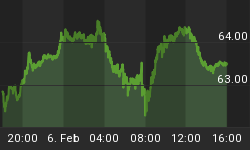
Last week's chart showed a NYA Index spike above the upper Bollinger Band. The NYA Index pulled back, and yesterday, it went back above last Tuesday's intra-day high of 10,083.46. This time, the NYA Index was below its Bollinger so that was a positive. But, lurking below this positive may be a negative coming from Institutional Investors as seen below.
Below is our Institutional Investor daily Buying and Selling activity chart. Yesterday, the Institutional Buying had a small down tick and the Institutional Selling had a small up tick. Institutional Investors were in Accumulation.
However, there is something I want to point out on this chart today ... If you look at the daily amount of Buying and Selling by Institutions, the lines show that there is a negative divergence on the Buying and on the Selling activity. This concerns me, because it puts Institutions in a position where their selling programs could be triggered.


