• 847 days Will The ECB Continue To Hike Rates?
  • 847 days Forbes: Aramco Remains Largest Company In The Middle East
  • 849 days Caltech Scientists Succesfully Beam Back Solar Power From Space
  • 1,248 days Could Crypto Overtake Traditional Investment?
  • 1,253 days Americans Still Quitting Jobs At Record Pace
  • 1,255 days FinTech Startups Tapping VC Money for ‘Immigrant Banking’
  • 1,258 days Is The Dollar Too Strong?
  • 1,259 days Big Tech Disappoints Investors on Earnings Calls
  • 1,259 days Fear And Celebration On Twitter as Musk Takes The Reins
  • 1,261 days China Is Quietly Trying To Distance Itself From Russia
  • 1,261 days Tech and Internet Giants’ Earnings In Focus After Netflix’s Stinker
  • 1,265 days Crypto Investors Won Big In 2021
  • 1,266 days The ‘Metaverse’ Economy Could be Worth $13 Trillion By 2030
  • 1,266 days Food Prices Are Skyrocketing As Putin’s War Persists
  • 1,269 days Pentagon Resignations Illustrate Our ‘Commercial’ Defense Dilemma
  • 1,269 days US Banks Shrug off Nearly $15 Billion In Russian Write-Offs
  • 1,272 days Cannabis Stocks in Holding Pattern Despite Positive Momentum
  • 1,273 days Is Musk A Bastion Of Free Speech Or Will His Absolutist Stance Backfire?
  • 1,273 days Two ETFs That Could Hedge Against Extreme Market Volatility
  • 1,275 days Are NFTs About To Take Over Gaming?
  1. Home
  2. Markets
  3. Other

Intraday Elliott Wave Analysis For OIL and E-mini SP500

Markets are very slow, since yesterdays US session when metals and energies fell sharply while US stocks futures and EURUSD did not move much. Generally speaking, we still think that the USD will extend its gains in days ahead, while stocks will continue to the upside.

S&P Futures remains in bullish mode since Friday and it seems that uptrend could resume soon as decline from latest swing high has a corrective look so we expect a move higher, and revisit of 1770 where break will open the door for new all-time highs.
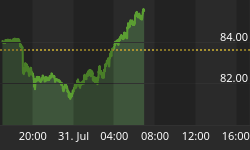
S&P Futures 1h

S&P500 Futures 1-Hour Chart

Yesterday, I was also talking about crude oil when I was tracking an incomplete corrective rally. Well, this rally has finished much earlier than I thought, and it was because of wave (c) which had a failure formation as price did not pass the wave (a) high. Anyway, to us the important should be only the current price action and not the past one. With that said, we are focused on impulsive development from end of wave 4 with current pause seen in smaller blue wave (iv) that is part of incomplete weakness. As such, traders should be aware of a new sell-off down to 92.00-92.30. Any intraday shorts should have stops placed above 94.30.

Crude Oil 1

Crude Oil 1-Hour Chart


Written by www.ew-forecast.com
2 For 1, Offer by ew-forecast.com :: Register Now And Save 50% >>> http://www.ew-forecast.com/register [Get 2 month package for price of 1] valid till midnight today


Back to homepage

Leave a comment

Leave a comment