


Commodity-based investments have historically displayed definitive cycles that experience dramatic peaks and valleys. Technical, chart-based analytical tools that anticipate price movements can give a heads up in advance of a sector's move. Indicators that confirm price direction are worth paying attention to when one weighs the evidence that a trend will continue. One such important indicator is a holding's trend line.
In my May 13th article, "Commodity Stocks - Trouble or Opportunity," I highlighted the coal and steel producers' stock indices. The timing of the article roughly coincided with the acceleration of the dollar's strength as cited by my colleague, Chip Hanlon. The deep pullback in these stocks discounted the dollar's renewed movement and, together with anecdotal evidence that demand for many basic materials was waning in the Far East, many of these securities returned to their the Bullish Support Lines, a crucial guide in Point and Figure technical analysis. When the steel producers' index subsequently breached its support line, for example, it told me to be cautious on this group in my managed portfolios. While some of these stocks may be due for a bounce, many must now see a 25% rise to take out overhead resistance and thus change the trend back to positive. Steel stocks tend to move quickly, but are you willing to wait for that sort of change? Coal producers were well above their support line and had a significant spread triple top breakout to solidify their up-trends. These are the types of signals that I use in the management of the portfolios I run at Delta. So, how do some other commodities-related charts look now?
Commodity Indices
First, investors need to realize that all commodities indices are not created equal; each uses a different balance of raw materials that emphasizes one commodity component over others. While the performance of each will vary depending on these weightings, unmistakable signs of trouble have emerged in many of the individual commodities and a yellow cautionary light is flashing with respect to those indices. At the very least, one should review current basic material exposure in his accounts.
Index investors, for example need to know that while The Rogers International Commodity Index currently has a 35% weighting in crude oil, (Jim Rogers came up with this weighting as he rode his Harley on 5 continents, not us& we're just jealous!), the CRB Index Spot is an unweighted geometric average of commodity price levels, The Dow Jones AIG Index has a 25% exposure to crude and natural gas and The Goldman Sachs Commodity Index has two to three times the weighting in Crude as the CRB or Dow Jones AIG.
One caveat: the following remarks are technical comments only. While I make recommendations primarily based on technical criteria such as those that follow in this report, investors must be aware of fundamental data for the stocks they buy as well as important data regarding delivery, market-moving government releases and other factors that may influence commodity pricing.
CRB Spot Index (CR/Y) - 300.83:
The CRB broke out of a big base late last year and lay in wait until February's triple top break at 290. This accelerated the upside move, taking just 1 month to reach 322. Since then, however, two lower tops and two broken bottoms have moved this index ever so close to the support line that has been intact since June of 2002. Cheerleaders for the CRB would be heartened by an upside break at $312, while realists must face the possibility of a trend line breach and a resulting 278-284 downside target.

Dow Jones AIG Commodity Index (DJAIG) - 150.73:
This chart is a bit slower moving and thus shows a longer history. Its up-trend started in June of 2002, same as the CRB. It spent most of 2003 and all of 2004 comfortably above the bullish line. The late 2004 sell off and subsequent consolidation led to a spike to 166 in March and then a downside reversal to lay right on top of support at 144. Implications of a break here could have risks to 132.

Commodity Components
There are decidedly mixed signals in some of the Industrial components of the indices mentioned above. Some remain above and some recently broke below trend lines. This is very much a time when discipline and vigilance will make the difference for investors.
Crude Oil (CRUDE) - 51.98:
Crude bounces off its support level as it has done twice recently. Amid calls that oil will top $100, its chart is telling a different story. The first sign of a resumption of the upward price movement would be a break out above $52.50. Long-term, however, the trend has stayed intact thus far.

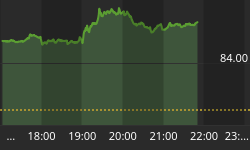
Aluminum (AL/) - 81.50:
Aluminum sold off along with other metals in the April-May period. It headed south on route 95 and kept going 'til it reached Florida, or 81 on this chart, below the Mason Dixon line at 83. A dead cat bounce occurred, only to lead to another sell signal taking AL/ down to the lows of last fall.

Lumber (LB/) - 369.50:
Lumber's trend just turned positive after undergoing a speedy round trip it turned negative early in May and re-emerged positive later the same month. The recent triple top break at 354 was a key sign something positive was developing. The bullish price objective now is 402.

With the recent rally in the U.S. Dollar now becoming extended in the short-term, investors can look for a bounce in non-Dollar holdings such as commodities. How such holdings perform will likely tell us more not only about the commodities themselves, but perhaps whether this Dollar rally is for real or merely a powerful counter-trend rally in an ongoing, multi-year bear market for our currency.
*The essay above is an excerpt from the one currently available with more charts and commentary at our website, www.deltaga.com.


