• 854 days Will The ECB Continue To Hike Rates?
  • 854 days Forbes: Aramco Remains Largest Company In The Middle East
  • 856 days Caltech Scientists Succesfully Beam Back Solar Power From Space
  • 1,256 days Could Crypto Overtake Traditional Investment?
  • 1,260 days Americans Still Quitting Jobs At Record Pace
  • 1,262 days FinTech Startups Tapping VC Money for ‘Immigrant Banking’
  • 1,265 days Is The Dollar Too Strong?
  • 1,266 days Big Tech Disappoints Investors on Earnings Calls
  • 1,267 days Fear And Celebration On Twitter as Musk Takes The Reins
  • 1,268 days China Is Quietly Trying To Distance Itself From Russia
  • 1,269 days Tech and Internet Giants’ Earnings In Focus After Netflix’s Stinker
  • 1,273 days Crypto Investors Won Big In 2021
  • 1,273 days The ‘Metaverse’ Economy Could be Worth $13 Trillion By 2030
  • 1,274 days Food Prices Are Skyrocketing As Putin’s War Persists
  • 1,276 days Pentagon Resignations Illustrate Our ‘Commercial’ Defense Dilemma
  • 1,276 days US Banks Shrug off Nearly $15 Billion In Russian Write-Offs
  • 1,280 days Cannabis Stocks in Holding Pattern Despite Positive Momentum
  • 1,280 days Is Musk A Bastion Of Free Speech Or Will His Absolutist Stance Backfire?
  • 1,281 days Two ETFs That Could Hedge Against Extreme Market Volatility
  • 1,283 days Are NFTs About To Take Over Gaming?
How The Ultra-Wealthy Are Using Art To Dodge Taxes

How The Ultra-Wealthy Are Using Art To Dodge Taxes

More freeports open around the…

Is The Bull Market On Its Last Legs?

Is The Bull Market On Its Last Legs?

This aging bull market may…

  1. Home
  2. Markets
  3. Other

GOLD And OIL Intraday Elliott Wave Analysis

GOLD rallied impulsively from 1226 up to 1258 followed by a three wave fall to 1234 in the last few days which we think it's a corrective move, labeled as wave b). With that said, we expect a new push higher, up in wave c) back above 1258.

GOLD 1h Elliott Wave

Gold 1-Hour Elliott Wave Chart

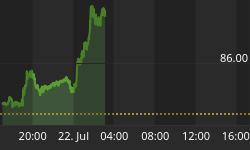
A strong leg down on Crude Oil yesterday with a daily close around 92 figure suggests that prices are in the middle of a new impulsive weakness, so we favour more downside. On the hourly chart we see some slow upward price action with appears to be minor red wave iv) that may stop at 92.45/92.70 mark and then send price down again, in wave v) of (iii). Any intraday shorts taken in that region should have stops placed around 93.50

Crude Oil 1h Elliott Wave

Crude Oil 1-Hour Elliott Wave Chart


Written by www.ew-forecast.com
14-Day Free Trial


Back to homepage

Leave a comment

Leave a comment