• 902 days Will The ECB Continue To Hike Rates?
  • 902 days Forbes: Aramco Remains Largest Company In The Middle East
  • 904 days Caltech Scientists Succesfully Beam Back Solar Power From Space
  • 1,304 days Could Crypto Overtake Traditional Investment?
  • 1,309 days Americans Still Quitting Jobs At Record Pace
  • 1,311 days FinTech Startups Tapping VC Money for ‘Immigrant Banking’
  • 1,314 days Is The Dollar Too Strong?
  • 1,314 days Big Tech Disappoints Investors on Earnings Calls
  • 1,315 days Fear And Celebration On Twitter as Musk Takes The Reins
  • 1,317 days China Is Quietly Trying To Distance Itself From Russia
  • 1,317 days Tech and Internet Giants’ Earnings In Focus After Netflix’s Stinker
  • 1,321 days Crypto Investors Won Big In 2021
  • 1,321 days The ‘Metaverse’ Economy Could be Worth $13 Trillion By 2030
  • 1,322 days Food Prices Are Skyrocketing As Putin’s War Persists
  • 1,324 days Pentagon Resignations Illustrate Our ‘Commercial’ Defense Dilemma
  • 1,325 days US Banks Shrug off Nearly $15 Billion In Russian Write-Offs
  • 1,328 days Cannabis Stocks in Holding Pattern Despite Positive Momentum
  • 1,329 days Is Musk A Bastion Of Free Speech Or Will His Absolutist Stance Backfire?
  • 1,329 days Two ETFs That Could Hedge Against Extreme Market Volatility
  • 1,331 days Are NFTs About To Take Over Gaming?
How The Ultra-Wealthy Are Using Art To Dodge Taxes

How The Ultra-Wealthy Are Using Art To Dodge Taxes

More freeports open around the…

What's Behind The Global EV Sales Slowdown?

What's Behind The Global EV Sales Slowdown?

An economic slowdown in many…

  1. Home
  2. Markets
  3. Other

E-mini SP500 And Crude OIL Intraday Elliott Wave Outlook

Staying with a dirrection of a trend should be the most important for traders and analysts. So despite a five wave down on the S&P 500 I am tracking a corrective price action, called an expanded flat where wave c is made by five waves. So if my interpretation is correct then we will see a bounce from around 1791-1795 zone. If we go down to 1775 then then is most likely not a flat. Guys, I will be back with you later, at the start of the New York session.

S&P500 (Dec 2013) 1h Elliott Wave Analysis

S&P500 1-Hour Chart

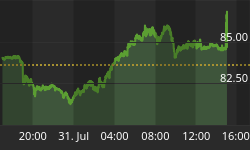
Recent leg to a new low on Crude Oil was made in three legs which is a structure of a corrective pattern, so we think that wave 4 from Nov 14 is still unfolding. We are now observing idea of a running traingle with wave (c) underway that is expected to stop around 94.60-95.00 region.

Crude Oil (Jan 2014) 1hElliott Wave Analysis

Crude Oil 1-Hour Chart


Written by www.ew-forecast.com
14-Day Free Trial


Back to homepage

Leave a comment

Leave a comment