


Due to the Christmas and New Year holidays this report got delayed by 2 weeks, although depending on the price action in January the next update will either be around 16-17th January 2014 or I will update the next report towards the 30th January 2014.
This is an update from the last report, the ideas still appear to be working so little has changed from the last report, and many stocks appear to still need a bit more downside.
I will keep it brief as usual and let the charts explain the ideas, with a little commentary.
The big theme going into 2014 is to be looking for an intermediate low on many Gold stocks, both Gold and Gold stocks in my opinion are much closer to a substantial low and one that traders can look to trade, than more downside, many of the Gold stocks have been completely destroyed, so I suspect we have limited downside based on the patterns and the potential for some decent upside moves. Although we will need to see Gold put in a low and finish a suspected 5 wave decline from the 2011 high, Gold currently appears to be in wave [5], so a target of 1150-1180.
GG (Gold Corp)
Monthly Chart

It appears to still be in wave 5 of [3].
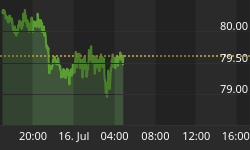
Weekly Chart

Staying under $23.22 keeps the trend looking lower; it appears to be in wave [iii] of 5, so a bit more downside needed as shown.
ABX (Barrick Gold)
Monthly Chart

This stock has refused to follow the other major Gold stocks lower and created a large divergence, as Gold and the $HUI index has pushed lower; ABX has held its ground. In an ideal world we see a new marginal low for wave 5 of [3].
Weekly Chart

Wave 4 of [3] might be a triangle; the messy decline could suggest that idea, although it's still too early to really confirm that idea. Staying below $20.00 keeps the trend looking lower. We will need some more price action to have a better idea. So I suggest waiting until it clears up.
Daily Chart

You can clearly see the corrective looking decline, that's a problem, as it allows for many ideas, which does not give us a clear idea to work with, so the best idea is to wait for the market to clear the ideas up.
NEM (Newmont Mining)
Monthly Chart

It appears to be still in wave 5 of [3], so a bit more downside still expected.
Weekly Chart

Currently I suspect it's still in wave [iii] of 5, so mostly likely targeting towards $20.00. Under $25.00 keeps the trend looking lower.
Daily Chart

A bit more downside seems likely as it makes it way towards the $20.00 area to complete wave 5 of [3], under $25.00 keeps the trend looking lower.
BVN (Compania De Minas Buenaventura)
Monthly Chart

It appears to be close to ending wave [3] of C.
Weekly Chart

Currently it appears to be in wave 5 of [3], so a low is expected shortly to end wave [3]. Then we should see a large bounce in wave [4].
Daily Chart

A closer look at the internals of wave 5 suggest this could be very close to a reversal, if you notice there appears to be a small wedge shape, that is what Elliotticians call an ending diagonal and is a terminal pattern.
There is strong support from current levels down towards $10.00.
The rest of this report can be downloaded here: http://www.wavepatterntraders.com/ElliottNewsletter/GoldStocks Report Update 17-11-2013.pdf
Until next time,
Have a profitable week ahead.


