


Dr. McHugh's new book, "The Coming Economic Ice Age, Five Steps to Survive and Prosper," is available at amazon.com at http://tinyurl.com/lypv47v
The Labor Department reported the December Employment and New Jobs Report Friday, January 10th, which proved uninspiring for the stock market. They reported that only 74,000 new jobs were created in December, which is about half what is needed to keep pace with population growth jobs demand, yet they also claimed that in spite of this abysmal new jobs report, miraculously the Unemployment Rate fell to 6.7 percent from 7.0 percent, as 490,000 unemployed people found new jobs. This is like saying one plus one equals six. Is there any point to the existence of the Labor Department? How much could our taxes be reduced if this bureaucratic embarrassment be completely eliminated? They wrote in their report, and I quote, "The number of unemployed persons declined by 490,000 to 10.4 million in December." They also wrote, "... total non-farm payroll employment edged up + 74,000." Really? Duh, okay. Further, without the seasonal accounting adjustment, December non-farm jobs actually fell by 246,000.
Stocks were relatively flat and mixed Friday, January 10th, 2014. It is possible the Industrials are forming a large Bullish Flag pattern, and the sideways pattern the past few weeks could be the corrective pennant portion of that Flag. Flags fly at half mast, so if this pattern is in fact occurring, once the pennant decline finishes, a very strong rally leg should begin, taking the Industrials toward 17,000 to 17,500ish.
Stocks should break out of their sideways malaise soon and generate a new vertical trend. Our key trend-finder indicators will confirm that new vertical trend shortly after it starts, and confirm the direction of that move.

One disturbing development that is fast concluding is a Rising Bearish Wedge pattern formation in the NYSE Cumulative Advance / Decline Line Indicator. If the coming major top in stocks will be typical, a preceding top in the NYAD should happen before the completion of the stock market top and the start of a massive economic decline.
Typical of major tops in the stock market, we should see the NYAD top first, perhaps several weeks or months before stocks top. This NYAD Rising Wedge pattern is close to completion, telling us the top in the NYAD is close at hand. Next should be a Bearish Divergence between the NYAD and the stock market. In other words, the Cumulative Advance / Decline Line should decline as stocks continue higher, perhaps for a few weeks or even months. This Bearish Divergence would be an early warning that a major top in stocks is fast approaching. So, it looks as if the NYAD is close to topping, and this expected Bearish Divergence with stocks should soon begin. Once stocks should reach their top, that will mark the end of the Grand Supercycle rising trend that started centuries ago. Further, we see that the Jaws of Death pattern in stocks is in its landing approach, its home stretch, and a top should arrive within several months. That top could arrive around 17,000 to 17,500ish in the Industrials.
For our subscribers, in this weekend's report at www.technicalindicatorindex.com, on pages 11 through 13, we show our Primary Trend Indicator as of December 31st. This indicator will be very important in confirming when the Coming Economic Ice Age has started, moving from its current Buy signal to a new Sell. These signals come very infrequently and have been incredibly prescient in identifying the start of major new long term trends in stocks.
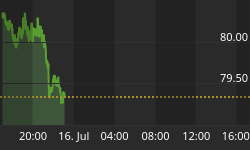
U.S. Bonds are in a bottoming formation, needing a bit more decline, then should start a powerful rally. We show that pattern to subscribers on page 54 in this weekend's report. What could make Bonds rally hard soon? A large decline in stocks would do the trick.


Gold remains inside a Declining Bullish Wedge that is approaching completion, with a downside price target close to 1,100. Very short-term, Gold is forming an {a} up, {b} down, {c} up move for wave 4-up of this Declining Wedge. Gold formed a sideways triangle for wave {b}, and Friday's rally is likely the on-time start of wave {c} up toward 1,260ish. That should complete small degree wave 4-up and then small degree wave 5-down will begin. Once the bottom arrives, a significant rally, large degree wave 5-up, will begin. Once Gold has bottomed, Gold should streak for $3,000 an ounce or more because it will be entering its large degree wave 5-up. Wave fives are typically the largest wave for precious metals. What could kick off a powerful rally in precious metals? A sharp decline in stocks driving folks to the safehaven of Gold would do the trick. This rally may be a few months away.
Do not be satisfied hearing what the market did; learn how to predict what the market is going to do. Join us at www.technicalindicatorindex.com as we study the language of the markets. Markets tell where they are headed. Technical Analysis is the science where we learn and apply the language of the markets. We are currently offering a FREE 30 Day Trial Subscription. Simply go to www.technicalindicatorindex.com and click on the Free Trial button at the upper right of the home page. If you would like to follow us as we analyze precious metals, mining stocks, and major stock market indices around the globe, We prepare daily and expanded weekend reports, and also offer mid-day market updates 2 to 3 times a week for our subscribers. We cover a host of indicators and patterns, and present charts for most major markets in our International and U.S. Market reports.
"Jesus said to them, "I am the bread of life; he who comes to Me
shall not hunger, and he who believes in Me shall never thirst.
For I have come down from heaven,
For this is the will of My Father, that everyone who beholds
the Son and believes in Him, may have eternal life;
and I Myself will raise him up on the last day."
John 6: 35, 38, 40


