


Paid subscribers during the month of June 2005 can receive a free copy of the book, Elliott Wave Principle, by Frost and Prechter, while enjoying an 18 percent discounted special annual price of $239. To subscribe, go to www.technicalindicatorindex.com and click on the Subscribe Today button. Or, if you are unfamiliar with us, email us with a request for a free 30 day trial subscription by clicking on the "contact us" button at our site.
Bonds keep rising and long yields keep falling. Forgetting the patterns for a moment, either one of two things are occurring. Either we are going to see a flat - possibly inverted - yield curve at a level of historic lows for interest rates (which means a recession and sharp equity market sell-off is coming), or some huge force (we won't mention names) is monetizing our nation's debt, buying Bonds clandestine, in order to keep long interest rates artificially low to support an ongoing real estate bubble. The Maestro confessed to Congress this week he'd finally figured out the "conundrum" in Bonds. He blamed it on global deflation from an expanding world workforce, but don't rule out the possibility that privately he uncovered the shifty-eyed, coke-bottled bespectacled rogue bureaucrat who's been adding Treasuries to the Fed's portfolio from a lonely terminal off some side street on a mosquito infested discreet island. In any case, we aren't going to have robust economic growth and a flying equity market with long-term interest rates under 4.00 percent, regardless of how phony the official economic numbers become to the contrary. If price action is legit, it could be a sign that smart money is fleeing to quality.

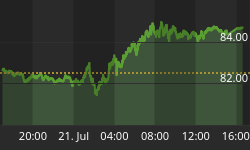
The chart shows Bonds completed an Elliott Wave countertrend rising Intermediate degree wave 2 in the form of a Broadening Top, Megaphone pattern. Because the direction of prices preceding this pattern was up, this is considered a top formation. Prices have risen so high recently that they pretty much blew up the Bearish Head & Shoulders top pattern, but formed another Bearish pattern, a Double Top. Bonds declined sharply - almost 3 points - since topping on June 3rd at 119.72, very close to the June 2003, 120.80 top. It looks like Intermediate wave 3 down is off to a fast start now that they apparently nabbed the varmint.
Our subscribers gain a unique advantage with analysis like this, along with a host of other technical analysis research, charts, and data for a modest annual fee of $239 per year. We offer less expensive six month subscriptions, and also free 30 day trial subscriptions for folks just discovering us.
We publish technical analysis newsletters of the major U.S. Equity, Bond, Commodity, Precious Metal, and Currency markets, using multiple tools simultaneously, including Elliott Wave Theory, Supply and Demand, Momentum Measures, Dow Theory, Chart Patterns, Cycles, Sentiment Measures, Fibonacci Ratio Measures for Price and Time turn-date targets, and Analogs of Current Price Behavior with the Past to name a few.
"Humble yourselves, therefore, under the mighty hand of God,
That He may exalt you at the proper time,
Casting all your anxiety upon Him,
Because He cares for you.
Be of sober spirit, be on the alert. Your adversary,
The devil, prowls about like a roaring lion, seeking someone
to devour. But resist him, firm in your faith,
Knowing that the same experiences of suffering
are being accomplished by your brethren who are in the world.
But after you have suffered for a little while, the God of all grace
Who called you to His eternal glory in Christ,
Will Himself perfect, confirm, strengthen and establish you.
To Him be dominion forever and ever. Amen."
1 Peter 5:6-11
Paid subscribers during the month of June 2005 can receive a free copy of the book, Elliott Wave Principle, by Frost and Prechter, while enjoying an 18 percent discounted special annual price of $239. To subscribe, go to www.technicalindicatorindex.com and click on the Subscribe Today button. Or, if you are unfamiliar with us, email us with a request for a free 30 day trial subscription by clicking on the "contact us" button at our site.


