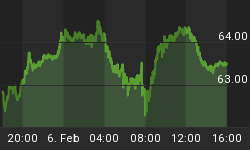
If it wasn't for the Fed, this DJI chart would already in big trouble. While the yearly DJI chart does show its first 2014 tick as being inside the expanding wedge pattern, a lot of money is being pumped in to try and get the DJI back up higher.
The question will be: Will this turn out to be money well spent? I ask the question because expanding wedge patterns typically identify exhaustion levels where a pull back occurs like at labels 1 and 2.


