


USD Index Weekly
Dollar Index is slow choppy and overlapping within two contracting trendlines for the last few years which we think it represents a triangle pattern, most likely placed in wave B) position. The reason is a five wave rally in wave A) from 2008 low which is first leg of a three wave A)-B)-C) recovery. As such, we will be looking up in wave C) after a completion of a triangle pattern. For now that's not the case yet, as we will need waves D and E before we may turn immediately bullish. In the next few weeks we however expect move up in wave D up to the upper trendline of the pattern.
USD Index Weekly Elliott Wave Analysis

USD Index Daily
We believe that USD Index has turned bullish after an impulsive rise from 79.00 at the start of November. This structure is important for a change in trend, even if just temporary. Based on a big picture with a triangle, we think that rise from 79.00 is start of a wave D that will unfold in three legs. If that is the case then recent downward move was wave (B) correction completed near 79.45. As such, move up in wave (C) seems to be underway towards 82.50-83.30 projected level.
USD Index Daily Elliott Wave Analysis

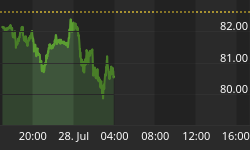
USD Index 4h
USD Index moved nicely to the upside, now trading very close to 81.30 so we are prepared for a strong push to the upside in wave 3, so we recently adjusted the count and labeled end of wave 2 at the latest swing low, at 80.50 . We still have alternate count on the radar screen for any surprise and another leg down to 80.40 before going up. In either case technical analysis for the USD is pointing up.
USD Index 4h Elliott Wave Analysis

By Gregor Horvat www.ew-forecast.com
14 days trial just for €1 >> go here


