


Dear Subscribers and Readers,
Special Alert: We will be switching from a 50% long position to a completely neutral position in our DJIA Timing System at the earliest opportunity on Monday. While the amount of short interest in the markets still remain high (which bodes well for the market in the longer-term), the global economic slowdown (particularly China) that we have been discussing over the last six months is coming to fruition. Coupled with the weakening technical conditions in the stock market since two weeks ago, it is most probably prudent to not stay long here (even though the Dow Industrials has been exhibiting relative strength against both the Dow Transports and the NASDAQ Composite).
Initially, my partner and I had thought about conducting a formal survey again this weekend, but after thinking about it, we are going to conduct a poll on our discussion forum instead. Why? Because we want our subscribers to have access to this information as well - as the results of this survey should allow our subscribers to gauge the amount of potential "resources} they have at their fingertips - resources that may help us and help them in evaluating the world economy in this globalized world of ours going forward. I believe both our subscribers and we can learn a lot from each other. The question this week is: Where do our subscribers reside? Please answer by choosing one of the options in our latest Market Poll!
Let's get on with our commentary and straight to the point. We are going completely neutral (from a 50% long position) in our DJIA Timing System on Monday morning. The recent technical weakness in the markets is making us at MarketThoughts.com pretty uncomfortable. There is also the issue of the slowing global economy. Sure, the amount of short interest on both the NYSE and the NASDAQ is at all-time highs (which will have very bullish implications for the stock market once a sustainable bull trend develops), but in the short and intermediate term, technical conditions and the worries of a slowing global economy rules over everything else. I will discuss the weakening technical conditions later in this commentary. For now, let's discuss the slowing global economy - something that we have been discussing over the last six months.
Since I came back from Hong Kong in the second week of January, I have been discussing something that has not been popular in the mainstream media - that is, the Chinese economy is going to slow down significantly sometime this year. The trigger? A huge overcapacity in the steel sector, in the construction sector, and in the auto manufacturing sector. I also said that the U.S. dollar wills strengthen considerably sometime this year - something that is now coming to fruition. Over the last few weeks, the former is also now evident for all to see, as witnessed by the recent slowdown in both the steel sector and in oil demand. Historically, the world's economy has slowed down as the U.S. current account deficit shrinks and as the U.S. dollar strengthens. While we haven't seen the U.S. current account deficit shrink in any substantial way, I believe we will see that later this year. The global economic slowdown is also evident per our MarketThoughts Global Diffusion Index (MGDI):

As discussed in our commentary from two weeks ago - the MGDI is constructed "using the "Leading Indicators" data for the 23 countries in the Organization for Economic Co-operation and Development (OECD)." This MGDI has "historically led or tracked the U.S. stock market and the CRB Index pretty well ever since the fall of the Berlin Wall. This "Global Diffusion Index" is basically an advance/decline line of the OECD leading indicators - smoothed using their three-month moving averages." As one can see, the rate of change in the MGDI (the second derivative) has fallen further since our last commentary about the indicator two weeks ago - from a reading of negative 4.61% to the current negative 5.35%. Please note that while the MGDI is calling for a global economic slowdown, there does not have to be a recession, as evident by the downticks in this indicator during late 1992, 1995, late 1998, and mid 2003. However, I will be very wary of either holding stocks or commodities here, and will most probably not go long again until I am seeing oversold conditions in the markets once again.
So what is the scenario I am currently envisioning for the stock market, you may ask? Well, I have always been troubled by the fact that the oversold conditions that we have been experienced over the last 18 months - March 2004, May 2004, July/August 2004, October 2004, and finally, April/May 2005 - did not render all my indicators to "very oversold" statuses - unlike even the corrections during the late 1990s when we had the Asian Crisis, and Russian/LTCM crises, for example. Even the correction in the Fall of 1999 was even more oversold than any of the corrections we have witnessed since January 2004. This is also evident judging by the stubbornly high bullish readings in the Market Vane's Bullish Consensus over the last 18 months. In order to finally have a sustainable uptrend, we will need to have more of a severe correction, and my "optimal" scenario is for that to happen over the next three to five months. If all goes according to script, then we will finally see a sustainable uptrend - an uptrend that may see the Dow Industrials rise to an all-time high.
Of course, a lot of this is predated on the conjecture that we will merely have a slowdown in GDP growth, and not a recession. I, for one, don't believe that the current chances of a recession are very high. Sure, we may have an inverted yield curve, but the chances of that happening in my book is also not very high - as I believe long bond rates may have already bottomed for awhile. The Fed should also be done tightening by the August 9th meeting. With the Fed Funds rate at 3.5%, the yield of 10-year Treasuries would need to decline by 55 basis points from its current levels (at the close on Friday) in order for us to see a flat yield curve. I don't believe the chances of that happening is very high. In fact, don't be surprised if the yield of the 10-year Treasuries is above 4.5% by the time August rolls along. Such a move is very possible given the bullish sentiment in bonds judging from the assets in the Rydex Government Bond Fund. Following is the chart of the amount of assets in the Rydex Government Bond Fund courtesy of Decisionpoint.com:

This bullish sentiment in bonds is echoed by the bullish position taken by PIMCO's Bill Gross, Morgan Stanley's Stephen Roach, and along with Merrill Lynch - keeping in mind that these are the same analysts who have been consistently calling for rising rates over the last few years. I do not profess to be a "know-it-all" and I also do not have a solid case on where bonds "should be" for the next three to five years, but I am willing to bet that bond prices have probably formed a short-term if not intermediate-term top here.
Of course, my bearishness in bonds and my relatively optimistic view on stock prices for the foreseeable future will all be shattered should a recession occur in the United States (or in China, for example) over the next six to nine months. Please keep in mind that most (if not all) of the world's economy is now dependent on the U.S. consumer. Six to seven years ago, the U.S. consumer had, in his head, the value of his 401(k) account when it comes to discretionary spending. Today, he has in his mind the price of his home and how much equity he has or how much he will save via the refinancing of his home. As regular readers should know, I have not been too optimistic/kind on housing prices over the last few weeks in our commentary. In fact, I believe that the slowdown in the appreciation of housing prices in some of the hottest areas in the United States is inevitable - and it can happen as quickly as in six to nine months. Such a position in real estate is reinforced when one examines the latest household's real estate data in the Federal Reserve Flow of Funds report for the first quarter of 2005. The following chart is a chart showing the percentage of household assets held in real estate vs. the quarter-to-quarter change (not annualized) in the OFHEO House Price Index:

Please note that this chart (as of 4Q 2004) was also shown in our June 1st commentary - which did not take into account the most up-to-date data as of last week. Therefore, you will see some minor inconsistencies in the data as this data is constantly revised by the Federal Reserve. No matter how you look at this, however, the message remains clear: real estate is definitely very overvalued judging by the percentage of household assets in real estate. This little observation is further compounded by the fact that bonds, stocks, and commodities have all enjoyed substantial appreciation over the last two years - and therefore, none of these other assets classes are undervalued either. So relatively speaking, real estate is overvalued. And absolutely speaking, one can also argue that bonds, stocks, and commodities are all overvalued relative to the U.S. dollar. I hope the message is now clear on exactly why I am worried about real estate prices and overcapacity in real estate assets.
Like I said, a recession is not a given here - even if real estate underperform (or God forbid, decline in price) over the next few years. In late 2000 and early 2001, just as everyone was arguing for a "soft landing," I declared that there could be no soft landing after such an excessive bubble in telecom and technology stocks - and the huge overcapacity as a result of that immense speculation. Moreover, the yield curve had already inverted by that time. Sure, real estate is today in a bubble, but the speculative euphoria is, I believe, a notch below the euphoria we had in the stock market in late 1999 and 2000. Of course, a great number of speculators will get killed, but as long as real estate prices do not crash (which I don't think they will) and as long as the yield curve does not invert, I believe I have a right to be optimistic. Of course, I am still greatly worried of the fact that there really is no great market for goods and services outside of North America. In due time, the consumers of Western Europe and Japan will need to take over the reins from the U.S. consumer as I don't believe the U.S. can or should let is current account deficit explode still further in order to save the world from an economic recession, once again. There are already too many imbalances in the system.
Another reason why I am relatively optimistic is the fact that we still haven't yet seen a "blow off" rally to mark the end of this cyclical bull market - a cyclical bull market that began in October 2002. I have mentioned this before, but during the cyclical bull markets of October 1966 to 1968 and the cyclical bull markets of May 1970 to 1972 (all within the context of the great secular bear market of 1966 to 1974), the percentage of total household financial assets held in equities and mutual funds has always jumped approximately two percentage points in the final quarter of those cyclical bull markets - suggesting that the way to end a cyclical bull market is typically with a "blow off" rally which sucks in every potential investor before collapsing in exhaustion. Following is a chart showing equities and mutual funds as a percentage of total household financial assets during that period:

The latest Federal Reserve Flow of Funds data shows that we still haven't gotten to that stage yet, as equities and mutual funds as a percentage of total household financial assets has stayed relatively flat since the end of the fourth quarter of 2003:

By the time this cyclical bull market is about to end, I expect this percentage to be at approximately the 30% level - given today's data. Of course, as Lord Keynes has mentioned often, I reserve to change my mind as new data comes into my hands. For now, the longer-term trend is still bullish, even though I do not recommend our readers to initiate long positions here.
Let's now take a look at the supposedly weakening technical conditions of the market - by first examining the recent action of the Dow Industrials vs. the Dow Transports. Please note that I have adjusted the starting date of this chart from January 1, 2003 to July 1, 2003, as this is a daily chart and the action was getting too congested to see clearly:
 >
>For the week, the Dow Transports declined 113 points even as the Dow Industrials rose 45 points - signaling a negative divergence on the part of the Dow Transports. Please note that the Dow Transports has been leading the Dow Industrials on the upside since October 2002. Also, note that the last divergence of the Dow Transports came in the form of a positive divergence in October 2002 - ultimately leading the Dow Industrials to the upside for the next two months. The current negative divergence of the Dow Transports, coming in the fact of a global economic slowdown and the potential popping of the U.S. housing bubble, definitely has very ominous implications for the Dow Industrials and for the other major stock market indices.
The weakening technical condition of the market is also evident in the put/call ratios (with the equity put/call ratios registering at 0.48 and 0.47 on Thursday and Friday, respectively), the ARMS Index (with the 10-day and 21-day moving averages at 1.14 and 1.04, respectively), the percentage of NYSE stocks above their 20-day (69.9%) and 50-day (68.2%) EMAs, and so on. The Dow Industrials has taken upside leadership away from both the Dow Transports and the NASDAQ. Over the last two years, this has usually had bearish implications for the overall stock market. While longer-term the bullish sentiment in both the AAII survey and the Investors Intelligence Survey isn't too overbought, they are definitely getting up there on a short-term basis. Let's now take a look at the most recent bulls-bears% differential readings in the AAII survey:

Okay, the AAII Bulls-Bears% differential did experience a slight decline from 30% to 26% in the latest week, but the fact that it shot up 42 percentage points over the last five weeks does render it slightly overbought - at least in the short-term anyway. On a ten-week moving average basis, however, this reading (at 2.1%) is still pretty oversold - suggesting that any potential declines going forward *should* be muted - at least in terms of timeframe anyway. However, please also keep in mind that the most ferocious declines in the stock market has been accompanied by an oversold reading in the AAII survey.
In the ST, the Bulls-Bears% Differential in the Investors Intelligence Survey is also getting slightly overbought - with the reading increasing from 22.8% to 29.7% in the latest week. However, similar to the AAII survey, the 10-week moving average of this reading is still very oversold at 19.37%. My sense is that this reading will continue to get more oversold in the weeks ahead as we finally carve out a sustainable bottom in the stock market. We will see.

I have said time and time again that the survey which has been bothering me that most has been the bullish sentiment coming out of the Market Vane's Bullish Consensus. In all the significant corrections over the last 18 months, we have never had a sub-50% reading in the Market Vane's Bullish Consensus. The lowest reading that we ever got during that period of time was 56% - registered during the correction in early to mid August of last year. During the latest week, the Market Vane's Bullish Consensus increased from 67% to 68%. In the latest three weeks, this read has been at 67%, 67%, and 68%, respectively - definitely a very overbought situation in the ST:

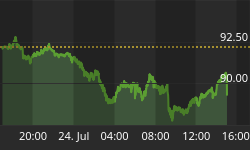
Conclusion: Based on this reading and the overbought conditions inherent in most of the other technical indicators that I have mentioned, this is definitely time to be cautious. Coupled with the fact that the global economy is continuing to slow down and a definite housing bubble, I believe the chances of a very significant correction over the next three to five months are now pretty high. I also believe commodities will continue to weaken. As for the US$, I am revising my ultimate upside target from a range of 90 to 95 to a range of 92.5 to 97.5 - with the US$ possibly at parity to the Euro again at some point in the next couple of years (I would highly recommend reading the latest John Mauldin commentary on demographics and the Euro). The long bonds are still a "sell" - and even though the global economy is slowing down, I do not see an inverted yield curve or a recession at this stage unless the U.S. housing bubble pops in a big way (in which case I definitely would not want to be living in China or any of the emerging markets around the world). We will switch to a completely neutral position in our DJIA Timing System this Monday morning.
Signing off,


