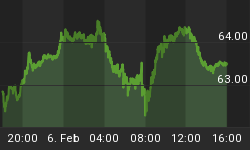
What didn't happen last Friday?
The answer, as seen on today's chart, is that all 5 key indexes were not able to move above their "end of December peak highs". They now have to re-test and get above those resistance levels in order to resume their up trending.
Note the first Index (on today's chart) which represents the "core holdings" held by Institutional Investors ... it has been moving in a sideways trading range since December 20th. So, it has not been able to trend higher since then and that could spell trouble. (See all 5 indexes on today's chart.).

We are now offering a FREE 10 Day Trial to our complete Advanced Investor Subscription with over 20 charts and analyses: Click Here


