


Are stock prices going to remain range bound forever? That seems to be what the standard measures of volatility are saying. In spite of all time lows in volatility on the NASDAQ 100 index ($VXN), and extremely complacent volatility measures on the SPX ($VIX), volatility selling hedge funds are selling options aggressively striving for yield. $10 billion has come into mutual funds selling options as a source of income. With volatilities this low, does it make sense to sell options for yield or is it better to buy them? Let's take a look at a few charts and see what we can see.
Here is a chart showing the new all time low on NASDAQ 100 volatility.
Just a hunch, but I have a strong feeling that sometime soon 20 will become support on the $VXN as opposed to resistance.
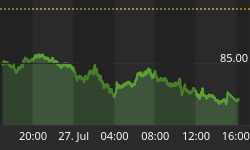
Here is a chart of the NASDAQ 100 index itself.
Notice that we are setting new lows of volatility in spite of significantly lower stock prices. Can this situation last? Of course not. Then again, it can probably last long enough to ensure that the maximum number of people is totally dependant on the relationship holding. Are we there yet? If not, I think we are close.
Here is a chart of the $VIX, the S&P 500 volatility index.
Once again I have a strong feeling that sometime soon 20 will become support on the $VIX as opposed to resistance.
Here is a volatility chart that most people have not thought about at all,
a chart of treasury yields vs. the Moody's baa-rated junk bond index.

Of all the above charts, I think the last one is the one to focus on. Here is where to watch it. If corporate spreads widen, stocks will likely head down, possibly with a small lag.
Complacency has been rampant in the corporate bond world. Companies, even junk rated companies have been repeatedly able to get financing, not for expansion but also for stock buy back efforts in blatant attempts to force share prices higher regardless of value. Of course corporate insiders have been bailing into these buybacks. Other companies have been taking on debt for mergers at absurd prices. Some of this came to an end with the blowup of General Motors (GM). How stock prices act in the future are likely going to depend on the sanity (or insanity) of corporate bond investor's willingness to go along with the nonsense we have seen to date. Thus the chart to watch is the last one. If corporate bond spreads widen, stock prices are likely to decline. Equity prices may decline anyway based on sheer nonsensical valuations and expected earnings growth, but should bond investor's appetite for risk shift direction, stock prices are almost guaranteed to follow suit.
With that thought in mind. Let's take a look at some of the underlying components likely to affect equity prices.
1) Corporate Bonds:
Those buying corporate bonds have one primary concern in mind: that the company will not default. The further out in duration and the lower in credit rating of the company, the greater the risk of default and thus the higher the yield demanded by bond investors for the risk. The difference between a corporate bond yield and a treasury yield of similar duration is the yield spread. Yield spreads fluctuate with investor sentiment, narrowing when investors grow more confident about a corporation's long term prospects, and widening when investors start showing signs of concern. When corporate bond spreads widen, equity prices typically decline. The reverse is also true, when yield spreads narrow, equity prices tend to remain firm. Yields spreads are now near historic lows. Default risk as measured by complacency seems to be almost nonexistent even though the economy is clearly slowing, leading indicators are pointed lower, foreclosures are on the rise, and the lending standards for mortgages is in the gutter. It remains to be seen how the multitude of hedge funds in the corporate bond carry trade can extradite themselves for this precarious situation. The downgrade of Worldcom to junk status was one of the major problems in 2002 that sent the equity markets tumbling. Perhaps GM will ultimately have the same affect.
2) Credit Default Swaps (CDS):
A Credit Default Swap is a bet between two parties on whether or not a company will default on its bonds. A CDS investor is therefore making essentially the bet as the corporate bond investor. The difference being the counterparty is not a company issuing bonds but a third party willing to speculate on the outcome. Credit Default Swaps are often used in lieu of corporate bonds when a fund manager can not find enough bonds of the right duration for a company in which they want to invest. In that case, if a hedge fund or other party wants to make a bet as to whether or not a particular company will default, all it has to do is find a suitable counterparty such as another hedge fund, a broker/dealer, or an insurance company, etc. to take the other side of the trade. In a typical CDS, the parties agree to swap cash flows so that one party gets a large payoff if the company defaults within a set period of time, while the counterparty gets periodic payments as long as the company does not default. In theory, CDSs should trade in tandem with corporate bonds. Then again, there is theory and there is practice. One reason they may not trade in tandem is due to the fact that CDS trades are party-to-party deals that are by their very nature extremely illiquid. Furthermore, because of this party-to-party relationship, it is not really possible to get an accurate handle on their size. Wall Street estimates put the CDS market at $5 trillion and the International Swaps and Derivatives Association has a global estimate of the CDS market at $8 trillion. Since the investment grade bond market is a mere $2 trillion and the Junk bond market just over $1/2 trillion, you can easily get a sense as to how carried away "investors" have gotten with CDS plays. In this writer's opinion, the CDS market is an accident waiting to happen, and I predict that accident will come. At any rate, given the size of the CDS market compared to size of the corporate bond market, is it any wonder that hedge funds were having "difficulties" when the price of GM stock went one way and GM bonds another?
3) Collateralized Mortgage Obligations (CMO):
A CMO is a group of mortgages with varying profiles, bundled together and then sliced into smaller pieces according to risk. The overall risk of the package is the sum of all the mortgages in it, but the profile of each slice can range from very safe to very risky. Investors can take on a less-leveraged exposure to the mortgage market by buying a safer slice or an investor can seek higher yields by buying a riskier slice.
4) Collateralized Debt Obligations (CDO):
CDOs work on the same principle of CMOs except that bonds or loans are put into the package instead of mortgages. CDOs are backed by actual bonds or loans but synthetic CDOs are backed by even more complex "bond-like" structures that build leverage on top of leverage in what some critics might call imaginary structures.
CDOs and synthetic CDOs are among the most complex financial instruments that you can find. They are often cut into custom tailored slices to suit the "needs" of an individual hedge fund. Obviously this complexity makes the CDO market very illiquid. Illiquid CDOs may contain illiquid CDSs as part of the structure. Given the party-to-party illiquidity of both the CDS and CDO markets with one potentially "supporting" another, it is obvious we have an enormous problem should anything go awry.
Synthetic CDOs have become hugely popular because they offer almost infinite ways for banks, insurers, hedge funds, and many other money managers to speculate on credit spreads-the spreads between different debt markets, between the debt of different issuers, between different classes of debt on a single company's balance sheet, and so on.
Other innovations include swaps on first-to-default and nth-to-default baskets, swaps on credit derivative indexes, and other highly complex swaps that attempt to cover more than just default risks by combining amortization, call, and prepayment provisions into a single package. There are also total-return swaps, which bundle a swap with its underlying debt security, and combination notes, which package pieces of CDOs to create a new security. Investors can also purchase over-the-counter credit options, and the Chicago Board of Trade and the Chicago Mercantile Exchange are both considering launching credit futures contracts. Gee, just what we need. How could we possibly have gotten by without that?
Some CDO portfolios are combining credit swaps on bonds and loans, and others are branching into swaps on asset-backed securities backed by anything and everything from commercial and residential mortgages to aircraft leases. Rating agencies have been hard pressed to keep up with all the new wrinkles.
Given the "obvious benefits" of these "investments", CDOs and synthetic CDOs have sparked a boom in "credit risk transfer" as hedge funds and banks are all trying to measure and capture anomalies in the spreads between various credit instruments. Let's flashback to 1998. Attempts to exploit anomalies in credit spreads is essentially what Long-Term Capital Management (LTCM) was trying to do when it collapsed in 1998 and nearly threw the U.S. financial system into a freefall. Lenders organized by FED, just minutes before an options expirations close, bailed the fund out. The FED has always stood ready to "bail out" the most stupid investments and that of course has led to even more widespread taking of risk such as we are currently witnessing.
Of course CDO activity is far more "sophisticated" today than when LTCM blew up. Whether that is reducing the risks or creating huge new perils is a subject of much debate. Perhaps I mean the subject is debatable until some six sigma event blows it all up. Here is something to ponder in the meantime: Given the literal explosion in the use of CDOs and CDSs what will happen if something causes credit spreads suddenly to widen far more than risk models anticipate or anyone expects? I suggest the answer will not be pretty to say the least. In that regard, I sense a lull before "the big storm" and that big storm will hit in the form of a housing bust, a junk bond blowup led by GM or Ford, trade wars with China, or something completely off everyone's radar including mine. There are indeed numerous potential "tipping points" and any of them could send us over the edge.
Looking back at the Russian crisis in 1998, the default occurred in August but the credit market did not feel the full effects until October. On that basis the true consequences of mark-to-market losses from General Motors and Ford debt downgrades as well as future demand for more corporate junk may take a few months to become apparent.
Perhaps the best chart to watch for signs of pending volatility trouble is the Moody's baa to treasury chart. I believe it will eventually reverse and spreads will dramatically widen. How fast that happens will determine the speed and magnitude of any potential problem. On the other hand, should the market decide that GM is not a problem (and nothing else bad happens either), perhaps we have one last insane blast up to new highs. In either case, those selling volatility for a pittance of extra yield at these complacent levels are forewarned.


