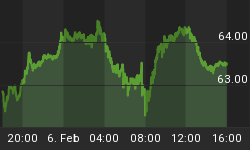
Inverse relationship with Gold and S&P500
Gold and S&P500 - Elliott Wave Forecast
Gold has bounced as a double bottom and it is likely that we should see further upside. The downside for the metals and especially Silver has been bearish, but the declined for the metals was relentlessly while the equity markets have gone parabolic. This is a very substantial inverse relationship and suggests reversals for both. Parabolic advances always end poorly and further upside for the metals is expected after the recent over sold conditions. When we see the reversal for the equity markets, we should see Gold move substantially higher. The metals have been setting up for a stronger rally as the market have prepared to roll over with the recent topping action. The markets are lower today and we can count the reversal in play, but its still early and we need to confirm since we could still see further topping action for this wave up.
The chart below illustrates the inverse relationship between Gold and the S&P500 that began in 2012. This chart was posted on the site on Jan 21st and suggests that we should see a substantial rally for Gold when the rally completes for the equity markets.
Gold and S&P500 overlay

S&P500
We can count this wave up for the S&P500 complete, but still need to see more action to confirm.
Gold
The Gold chart suggests that we should see further upside and a break of the upper trendline will support the forecast for further upside. We still need to see a little more action to confirm that the reversals are in play, but this newsletter was issued to give you a heads up on the expected action.
Happy Trading!!!
These charts are only a guide so that you can follow the action and monitor the expected outcome. The action could play out exactly as illustrated or it may need minor adjustments as we follow it through.
If you are interested in viewing these updated charts and other detailed charts with targets on a daily basis, please see the registration details below.
To learn more on the status of Gold, Silver, HUI and the USD, please visit the link below for registration details.
The commentary and forecasts are updated daily, including intraday commentary and chart updates. Fibonacci pivot dates and cycle analysis are also utilized to forecast reversal dates. The indices covered include the NASDAQ, DOW, S&P 500, SOX, Nikkei, DOW Transports, TSX, BSE, KSE, AORD, HSI, DAX and FTSE. Commodity charts include Copper, XOI, Crude Oil, Nat Gas, Gold, GLD ETF, Silver, SLV ETF, HUI and/or the XAU (Gold and Silver index). Additional Elliott Wave charts cover the US Dollar (USD), EURO FXE ETF, Canadian Dollar (CAD) FXC ETF, 10 Year Treasury Note Yield (TNX), Bank Index (BKX)
With market timing and Elliott Wave Forecasts, we can be on the right side of the market.


