


Precision timing for all time frames through a multi-dimensional approach to technical
analysis: Cycles - Breadth - P&F and Fibonacci price projections
and occasional Elliott Wave analysis
"By the Law of Periodical Repetition, everything which has happened once must happen again, and again, and again -- and not capriciously, but at regular periods, and each thing in its own period, not another's, and each obeying its own law... The same Nature which delights in periodical repetition in the sky is the Nature which orders the affairs of the earth. Let us not underrate the value of that hint." ~ Mark Twain
Current Position of the Market
SPX: Very Long-term trend - The very-long-term cycles are in their down phases, and if they make their lows when expected (after this bull market is over), there will be another steep decline into late 2014. However, the Fed policy of keeping interest rates low has severely curtailed the full downward pressure potential of the 40-yr and 120-yr cycles.
Intermediate trend - The anticipated decline into late February has started.
Analysis of the short-term trend is done on a daily basis with the help of hourly charts. It is an important adjunct to the analysis of daily and weekly charts which discusses the course of longer market trends.
MORE WEAKNESS AHEAD!
Market Overview
According to the Trader's Almanac, the market trend in January sets the trend for the rest of the year!
Historically, this has been a fairly reliable indicator. This year, it has the support of the failed Santa rally discussed earlier, and the longer-term bearish pattern suggested by the Kress cycles which predict a market low around October.
Over the short term, based on cycles, the current decline is likely to continue into late February. The short-term forecast is also enhanced by the degree of distribution at the top apparent on the P&F chart which projects a price low around 1680 - much lower that what has been achieved so far.
And what about the short-short term? So far, selling in most indices has been contained by the mid-December low, although DJIA did trade below it -- but not decisively. A short-term cycle low is (was) due around this time frame. Friday's opening action suggests that it might have bottomed; but if it extends into early next week (or has already failed), we could see another quick drop before another relief rally takes hold.
Structurally, we are looking for confirmation that wave A of the decline is complete. It may have ended at 1771, followed by a rally which fell just short of a .382 retracement of the downtrend. The bottoming cycle may have prevented it from extending higher until after it had turned up and a retracement of 50% could still take SPX to about 1810 and .618 to about 1820 with one of these retracement levels marking the completion of wave B. If, however, wave B is already in place with the rally to 1799, expect more weakness to occur starting Monday.
Chart Analysis
The daily SPX chart (courtesy of QCharts) shows how, during the last 8 months of its on-going five-year bull market, the index rose steadily without any appreciable correction until it reached the top of its bull market channel where it finally met with enough resistance to induce some profit-taking. It took some negative news from China which rattled emerging markets at the same time that the Federal Reserve made a decision to taper its bond purchase program to stop the buying spree that had driven most equity markets well beyond their former all-time highs. Of course, these are the "fundamental" reasons that are being given -- those that we can readily understand and accept. However, the more esoteric factors which are the real causes of market fluctuations remain beyond the grasp of the average investor. As an example, long-term cycles bottoming toward the end of 2014 are long overdue to exert downward pressure on stocks; but now that they have started to do so, it will be difficult for the market to continue ignoring them.
So far, the correction has been very limited, but it should increase in intensity over the next three weeks in conjunction with bottoming short and intermediate cycles. By the time it is over, we could find prices at the bottom of their long-term (purple) channel which has its origin at the low of October 2011. Then we will see if the down-trending long-term cycles will permit the index to make another all-time high, or if 1850 will turn out to be it. If the long-term high has been reached, it will be reasonable to expect that high to also be the top of the bull market.
I have drawn the channel which best represents the current correction. We can't even start considering that the correction has come to an end until prices are ready to move out of it. We'll get a better view when we analyze the hourly chart.

The oscillators are clearly not ready to signal a reversal! The MACD (top) is still declining and the histogram has hardly begun to show deceleration. Although some minor divergence is showing in the bottom oscillator, something more tangible will be needed before we can be alerted to an imminent reversal.
The hourly chart (also courtesy of QCharts) is not giving clear signals at this time. The first decline from the top completed phase II of the distribution pattern, and was followed by a fairly shallow rally equivalent to about a .382 retracement. Assuming that reaching the projection determined by phase II of the distribution pattern (1271) represents phase A of the entire correction, could we already have completed phase B at 1799? That does not seem likely but if we have, we are in an extremely weak market and should be prepared to see an immediate resumption of the decline. Furthermore, if the small consolidation pattern between 1771 and 1800 is a bearish flag, we should quickly drop to 1720, the distance which represents the length of the "mast". That remains to be seen!
Just to keep us guessing, on Friday, the oscillators started to roll over after becoming overbought. This is usually a prelude to a continuing decline, except that this is normally accompanied by negative divergence which is mostly lacking in this case. We will have to wait until Monday to see if there is some follow-through selling to what took place at the close of Friday.

Cycles
From last week: "The cycles due toward the end of February have started to exert pressure on the market - probably assisted by the longer-term cycles bottoming in the fall. It is too soon to determine if the latter will keep things going until then, or if the market will be allowed to make a new high, first."
Monday's action should determine whether a minor cycle made its low on Friday, will do so early next week, or had little impact on a weak market.
Breadth
The McClellan Oscillator and Summation Index (courtesy of StockCharts.com) appear below.
The pattern of the McClellan Oscillator continues to follow that of the market. After making a top as a sideways consolidation, it has dropped to its previous low and is holding there. This is a level which represents a short-term correction for this indicator and from which it usually bounces. Next week we will find out which path it takes from here. The Summation Index turned down after making a double-top but its RSI suggests that its correction is not over. Only once in the past year did it turn back up in mid-course, but that was in a stronger market than the one in which we find ourselves today. Both indicators should move lower before the correction is over.


Sentiment Indicators
The SentimenTrader (courtesy of same) long-term indicator is showing a reading of 60 for the third consecutive Friday, most likely confirming that the correction is not over. When it is complete, we are likely to see a reading of at least 50.

VIX (Velocity Index)
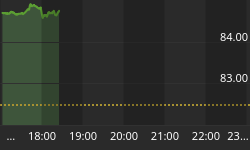
VIX has overcome a short-term trend line, its 200-DMA, and a former short-term top, and is challenging a much longer trend line. This looks like the start of a larger move, especially since that former top represents the price level in December which SPX is currently trying to hold. Most likely, VIX is not finished and will challenge the next higher short-term top at 21. I am not sure what this means, but the P&F chart of VIX has a much higher projection -- to 30. If achieved, it would surpass all the short-term tops going back to December 2011. If it should go that high, it will be out of sync with the current SPX correction which is not supposed to be that deep. Or will it be a warning of what's coming?

XLF (Financial Index)
XLF is following the pattern of DJIA and is a little weaker than SPX. It currently has the support of both the former low and its one year+ trend line. If it should decline below that level right away, it could signal accelerating weakness for the market.

TLT (Barclays 20+ year Treasury bond fund)
TLT continues to move opposite to the price of equities. It is about to challenge a former weekly high where it could find some resistance. If it can move higher, the next resistance level will first be just above the March 2012 low where it hesitated before, and then the March 2013 low. These should at least slow down its rising trend.

GLD (ETF for gold)
GLD has been rising ever since its 25-wk cycle turned up but it is hesitating at a one-year downtrend line. If it can break free, it should be able to continue up to the next trend line which coincides with its former short-term high around 137.

UUP (dollar ETF)
UUP continues to stagnate. It has not gone down, but it does not look anxious to go up either. More time and more tapering may be necessary to encourage it to start on a genuine uptrend.

USO (United States Oil Fund)
USO also has made little progress but in its case, continuing to decline is a much more likely prospect. Its inability to have a serious bounce off its (shallow) long-term trend line is a sign of weakness. After what has essentially been a sideways consolidation of 5 years, breaking that trend line will put it back in a long-term downtrend.

Summary
SPX is about halfway through an intermediate correction, both in price and in time. After a drop of 80 points it is consolidating in what could be a bearish flag pattern. Next week should tell us if it is ready to continue its decline right away or if it will require some additional consolidation first.
FREE TRIAL SUBSCRIPTON
Market Turning Points is an uncommonly dependable, reasonably priced service providing intra-day market updates, explanations, and commentary, plus detailed weekend reports. It is ideally suited to traders, but it can also be valuable to longer-term holders since price projections are provided using Point & Figure analysis along with best-time estimates obtained from cycle analysis.
The recent addition of discussions about UPRO and SPXU to the daily updates should be of interest to those who trade the SPX.
For a FREE 4-week trial, Send an email to: ajg@cybertrails.com
For further subscription options, payment plans, weekly newsletters, and for general information, I encourage you to visit my NEW website at www.marketurningpoints.com. By clicking on "Free Newsletter" you can bring up the latest newsletter which is normally posted on Sunday afternoons (unless it happens to be a 3-day weekend; in which case it could be posted on Monday).


