• 867 days Will The ECB Continue To Hike Rates?
  • 868 days Forbes: Aramco Remains Largest Company In The Middle East
  • 869 days Caltech Scientists Succesfully Beam Back Solar Power From Space
  • 1,269 days Could Crypto Overtake Traditional Investment?
  • 1,274 days Americans Still Quitting Jobs At Record Pace
  • 1,276 days FinTech Startups Tapping VC Money for ‘Immigrant Banking’
  • 1,279 days Is The Dollar Too Strong?
  • 1,279 days Big Tech Disappoints Investors on Earnings Calls
  • 1,280 days Fear And Celebration On Twitter as Musk Takes The Reins
  • 1,282 days China Is Quietly Trying To Distance Itself From Russia
  • 1,282 days Tech and Internet Giants’ Earnings In Focus After Netflix’s Stinker
  • 1,286 days Crypto Investors Won Big In 2021
  • 1,286 days The ‘Metaverse’ Economy Could be Worth $13 Trillion By 2030
  • 1,287 days Food Prices Are Skyrocketing As Putin’s War Persists
  • 1,289 days Pentagon Resignations Illustrate Our ‘Commercial’ Defense Dilemma
  • 1,290 days US Banks Shrug off Nearly $15 Billion In Russian Write-Offs
  • 1,293 days Cannabis Stocks in Holding Pattern Despite Positive Momentum
  • 1,294 days Is Musk A Bastion Of Free Speech Or Will His Absolutist Stance Backfire?
  • 1,294 days Two ETFs That Could Hedge Against Extreme Market Volatility
  • 1,296 days Are NFTs About To Take Over Gaming?
  1. Home
  2. Markets
  3. Other

Elliott Wave Analysis For GOLD And OIL

GOLD Four Hour

Gold is now above 1300, making an extended leg from 1251, triangle low. Notice that we have adjusted the wave count but actually massage is the same; we see a corrective advance from 1181 now moving into 1300-1315 resistance. We are observing more simple count now, a zigzag with a triangle placed in wave (b). We also know that this wave (b) pattern CANNOT be labeled as wave two, because triangles never occur in wave two position. So because of that we are even more confident that rally is a contra-trend and that gains will be limited.

GOLD 4h Elliott Wave Analysis

Gold 4-Hour Chart


OIL Four Hour

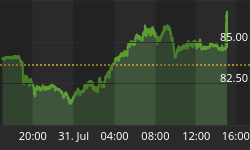
Crude oil has been trading nicely higher for the last few days, towards our 100-101 projected target where we expect a top formation for wave A after five waves up from 91.18 low. We know that after every five wave market will move in opposite direction in minimum three legs. So we anticipate a retracement in wave B ideally back to 97.00 area, probably next week.

OIL 4h Elliott Wave Analysis

Oil 4-Hour Chart


Written by www.ew-forecast.com
14 days trial just for €1 >> http://www.ew-forecast.com/register


Back to homepage

Leave a comment

Leave a comment