


Paid subscribers during the month of June 2005 can receive a free copy of the book, Elliott Wave Principle, by Frost and Prechter, while enjoying an 18 percent discounted special annual price of $239. To subscribe, go to www.technicalindicatorindex.com and click on the Subscribe Today button. Or, if you are unfamiliar with us, email us with a request for a free 30 day trial subscription by clicking on the "contact us" button at our site.
M-3 is rising hard again, the Federal Reserve pumping aggressively in clandestine fashion. Seasonally adjusted M-3 rose 18.1 billion last week, is up 42.2 billion over 2 weeks, is up 64.0 billion over 3 weeks, and 152.6 billion over 12 weeks. These translate into the following annualized rates of growth in the money supply: 9.7%, 11.4%, 11.5%, and 6.94%. But these are government adjusted M-3 numbers. Take a look at the profligate growth in the raw M-3 figures this week: Up $79 billion in just the last week alone, a 42.5 percent annualized rate of growth! Up 98.6 billion the past two weeks, a 26.6 % annualized rate of growth. You see, dear friends, the Fed is full of malarkey. They are not tightening money supply. Oh, sure they are raising short-term interest rates, but it is a great deception thrust upon a wanting investment community. M3 growth is on fire!

How are they doing this? The diagram shows exactly how the Fed can control the amount of M3 that is in the economy at any given time. Think of it like this. Dollars are either in the economy, or at the Fed, but cannot be in both places at the same time. If dollars are at the Fed, then they are not part of the money supply. To reduce the amount of M3 in the economy at any given time, the Fed simply sells something to someone - anyone - who is not part of the Federal Reserve System. They could sell bonds to Merrill Lynch, or stocks to Morgan Stanley, or office furniture to a second hand furniture retailer. What happens here is, something that is not U.S. dollars (some product or financial instrument) is shipped into the economy in exchange for U.S. dollars. U.S. Dollars leave the economy and go to the Fed as payment for what the Fed sold.
If the Fed wants to increase the money supply in the economy, they simply buy something - anything - in exchange for U.S. Dollars. For example, if the Fed buys bonds from Citigroup, bonds leave the economy (Citigroup's inventory of bonds decreases) and U.S. Dollars are placed into the economy that were formerly at the Fed (Citigroup's cash position rises). Or, if the Fed buys a portfolio of S&P 500 stocks from an offshore account, equities in inventory of the banking house that owned them declines and that banking house's U.S. Dollar cash position increases. The Fed's secret portfolio of equities increases (and of course equity market values rise, or don't fall as much as they might have otherwise without the big buyer). Or, if the Fed buys 14 tons of bricks from Joe's Block and Brickhouse, Incorporated, there are less bricks in the economy, but more dollars as the Fed pays U.S. Dollar denominated money to Joe's for the bricks.
Now the Fed is in a unique position in that it can print all the money it cares to, with no accountability. It need not earn it first, need not explain that it is printing it. It just prints it and buys stuff, and voila, the price of what they buy is supported and money supply rises.
Now, money supply can grow from another source outside the Fed, something called the velocity of money. What happens here is, money multiplies, it begets baby dollars, which beget grandbaby dollars, and great-grandbaby dollars, etc... This occurs through the process of commercial bank lending. When a loan is created, two things happen. A loan becomes an asset on a bank's books, and the money it loaned to a borrower either gets immediately deposited back into a bank, or gets spent and the merchant who did business with the borrower suddenly has money he didn't have before and deposits it in his bank. Before the loan, that new deposit did not exist, so was not counted in the money supply figures. After that loan, there is a brand spanking new deposit in a bank somewhere which is now counted as money. Banks tally up their deposit totals regularly and report them to the Fed, which is where the Fed gets its total money supply figures from. Fed examiners check that the figures are right.
Now the velocity of money growth comes into the picture because that new deposit - that never before existed - will now be loaned by the bank fortunate enough to be holding it. That second loan will result in a second new deposit that will land in another bank somewhere else after the money from that second loan is spent somewhere. And so on.
But here's the key point I want to make: The Fed has the M-3 numbers coming in from banks across the country, knows whether the velocity of money is fast or slow, knows whether lending is on the rise or not, knows what a healthy rate of M-3growth is for the economy given trade deficits, GDP growth, inflation, etc..., so the Fed has both the knowledge and the power to make key adjustments to the Money Supply by buying or selling stuff from/to the economy. Therefore, if M-3 is up 42.5 percent in one week, the Fed has allowed or caused that to happen. The Fed is responsible and in control.
If the Fed allows money supply to grow at an astronomical rate, something far beyond normal, something inconsistent with its rhetoric regarding "measured" increases in interest rates, then it is occurring because the Fed knows something. What do they know? If M-3 is growing twice as fast as GDP, five to twenty times as fast as inflation, is growing at an outrageous rate during an interest rate tightening phase, then the Fed sees a risk out there somewhere that threatens the velocity of money process, threatens to contract money supply, threatens to devalue wealth - some threat or risk the Fed feels it must compensate for. What threat do they see that they must allow outlier levels of liquidity to flow into the economy? We don't know. But by watching the M-3 numbers, and knowing the Fed's power over those numbers, we can logically conclude they see something they don't like very much, a risk sufficient that they feel the need to act upon it, long before the threat becomes public.
Maybe they fear an equity market meltdown. It truly amazes me how often M-3 growth goes bonkers just at the precipice of an ugly equity market technical picture. Maybe a derivatives blowup; or a hedge fund collapse; or, use your imagination. It is absolutely no coincidence that equities rose sharply from April 20th. For the three weeks leading up to April 20th, M-3 was up 67.2 billion, or 12.1 percent annualized. Hey, they had to stop the March 7th slide. But for the kind of M-3 increase we've seen this past week, we have to ask, "What else is out there?" Is this about stemming a threat? Or, are they just in the mood to goose the economy by pumping the equity market?
They don't have to be directly involved in equity transactions to boost equities. They could lend money to one of the Big Boys and let them do the buying. Or, they could have a friendly foreign central bank do it for them. All this money creation, is good for Gold, bad for the U.S. Dollar - unless every other central bank out there is goosing their fiat currency as well - then indifferent for the dollar.
The above following chart shows the Fed's handiwork. From June 2002 to June 2003, the Fed flooded the markets with liquidity. About four months after they started, we got a rally that lasted about the same amount of time - a year. But the Fed let M-3 decline a bit in mid to late 2003. That subsequently led to the DJIA decline from February 2004 to October 2004. But the Fed wanted to put the brakes on the accelerating equity market slide, so they pumped dollars into the system - hard - starting in February 2004 when they saw equities declining. They pumped for about four months and stopped what I believe could have been a crash in April/May 2004. At that time, the technical landscape was horrid, including a rare and ominous Hindenburg Omen, as Kennedy Gammage noted back then. The pumping through June 2004 led to the rally from August 2004 through year-end, including the post-election rally. But the pause in M-3 growth from June 2004 through October 2004 subsequently permitted the Dow Industrials' decline from March 7th through April 20th. The recent rally from April 20th was fueled by the liquidity pumping that the Fed initiated from October 2004 through now.
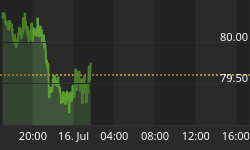
What the Federal Reserve has done in stealth fashion is to devalue the American Dollar by 50% over the past five years. The trade weighted dollar was at 120 in 2002, and recently fell 50% to 80. Money Supply was $6.6 billion in January 2000, and today it is $9.7 billion, 46.9 percent more fiat currency in five years. This is why it seems like everything has doubled in cost since the turn of the millennium. But wages have not come close to keeping pace. Of course the government CPI and PPI figures have hidden the devaluation, hyperinflationary truth, as well. They don't want us to know. Worse, one benefit of currency devaluation is the repudiation of debts. Unfortunately, just the opposite has occurred. Americans and our government have more debt than ever. Sadness.

Our subscribers gain a unique advantage with analysis like this, along with a host of other technical analysis research, charts, and data for a modest annual fee of $239 per year. We offer less expensive six month subscriptions, and also free 30 day trial subscriptions for folks just discovering us.
We publish technical analysis newsletters of the major U.S. Equity, Bond, Commodity, Precious Metal, and Currency markets, using multiple tools simultaneously, including Elliott Wave Theory, Supply and Demand, Momentum Measures, Dow Theory, Chart Patterns, Cycles, Sentiment Measures, Fibonacci Ratio Measures for Price and Time turn-date targets, and Analogs of Current Price Behavior with the Past to name a few.
"I have been crucified with Christ; and it is no longer I who live,
but Christ lives in me; and the life which I now live in the flesh I live
by faith in the Son of God, who loved me, and delivered Himself up for me."
Galatians 2:20
Paid subscribers during the month of June 2005 can receive a free copy of the book, Elliott Wave Principle, by Frost and Prechter, while enjoying an 18 percent discounted special annual price of $239. To subscribe, go to www.technicalindicatorindex.com and click on the Subscribe Today button. Or, if you are unfamiliar with us, email us with a request for a free 30 day trial subscription by clicking on the "contact us" button at our site.


