


A 3-dimensional approach to technical analysis
Cycles - Structure - Price projections
"By the Law of Periodical Repetition, everything which has happened once must happen again, and again, and again -- and not capriciously, but at regular periods, and each thing in its own period, not another's, and each obeying its own law ... The same Nature which delights in periodical repetition in the sky is the Nature which orders the affairs of the earth. Let us not underrate the value of that hint." -- Mark Twain
A Review of the Past Two Weeks
Most indices added to their gains last week, including crude oil, gold and the US dollar, with crude reaching a new high and the Russell 2000 challenging its all-time high. Two of the leading indicators, the Security Brokers Index and the Banking Index are confirming the move, but I think that it is significant that the NASDAQ, GE and the Dow Transportation index are not. Since Friday was quadruple witching option expiration, the last little spurt into the end of the week could have been the result of options expiring and short-covering.
The McClellan oscillator reached a recovery high in May and has remained positive since that time. However, minor divergence to prices is currently beginning to appear.
The new highs/new lows index has also been in an up trend since the April lows, and on Friday reached its highest reading since that date.
The Volume action of special significance and will be discussed later.
Current Position of the Market.
SPX: Long-Term Trend - The long-term trend turned up in October 2002 in conjunction with the 12-year cycle. It was reinforced by the 10-year cycle which turned up in the Fall of 2004. The markets are approaching a decisive time period and it is unclear at this time if the current market strength represents a final peak or the beginning of another powerful up trend which will last until the end of the year.
SPX: Intermediate Trend - It is now obvious that the intermediate-term trend correction which began in March came to an end in mid-April. What is not clear is what happens in the weeks ahead. There is no sign of significant weakness developing in the market at this time but, as stated above, we are entering a critical time frame with mixed messages that will take a few more weeks to interpret.
SPX: Short-Term Trend - Two weeks ago, I wrote: The short-term trend has gone a little longer than I had expected, but a top could be made by next week. A short-term top could have been made on Friday.
Because of market volatility, the short-term trend is better analyzed on a daily basis with the help of hourly charts. This is done in our daily market updates and Closing Comments.
Daily Market Analysis: If you would like to receive an explanation of how I arrive at buy and sell signals and sign up for a free 6-week trial period of daily comments, please let me know at ajg@cybertrails.com
What's Next?
My analysis focuses primarily on cycles because I have found this to be the best timing tool for an advance warning of turns. But this does not tell me exactly when the tops will take place, or how far the trend will go before it reverses itself. This refinement comes from using conventional technical analysis and Fibonacci projections.
Two important cycles are playing a role in today's intermediate market trend. One is the 120-week cycle which is ideally due to make its low within the next 3 weeks, and the other is the 72-week fractal which has shown remarkable rhythmic precision in the past few years and which is also due in the 1st week of July.
The 72-week pattern results either in a high or low point in the market, whereby the 120-week cycle always brings about a low point when it completes its phase. I had assumed that both of these would end at the same time bringing about a significant decline into the first week of July. However, this has not taken place and the recent market strength has rendered this assumption questionable. It is possible that the two rhythmic patterns might be going in opposite directions.
The other possibility is that the long-term cycles -- which I still consider to be in an up trend until proven otherwise -- are overwhelming the intermediate term cycles, and that the pull-back into an intermediate low could be rather mild and followed by another strong advance to new market highs. But there are potential problems beginning to appear which could negate this scenario.
The McClellan oscillator is one of the best technical tools to confirm short and intermediate-term market trends. So far, it has not shown any weakness, but the minor divergence that is beginning to appear could be a warning that a 2 to 3-week pull-back is ready to start. Also, based on past patterns, a retracement is due. A short term top would be confirmed if we begin to get negative readings in the hourly and daily advance/decline figures.
The new highs/new lows index, another way to measure market breadth, confirmed the action of the McClellan oscillator by making a recovery high this past Friday. This indicator is not as sensitive as the McClellan, but its 10% smoothing is a reliable gauge of the intermediate trend. What it does in the next few weeks or months should help define the final bull market high. There is little doubt that the final top is not too distant. The 4-year cycle low which is due next October has been one of the most reliable cycles, as the long term chart of the Dow (which appears below) clearly demonstrates, and it will begin to exert more and more downward pressure with every passing week.
Another indicator which I consider to be one of the best forecasting tools, especially when used in conjunction with the advance/decline, is my up/down ratio (buying and selling pressure) indicator. Some of its most important features are its adaptability to all time frames, and that it gives warnings far in advance of other indicators. Currently, the 5-minute oscillator strongly implies that Friday was a minor top, the hourly version could give a sell signal early Monday, and the daily ratio, which correctly forecasted the April low, looks very negative.
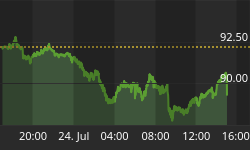
One of my favorite leading indicators is GE. It made its high a month ago and on Friday, it bounced off an important short-term up-trend line. If it should break through this trend line in the next few days, the next level to watch is 35. This has provided support for the past 6 months, and if it is broken to the downside, it will signal that the end of the bull market is imminent.
There are other negatives beginning to appear. One of the most significant is the recent poor performance of the Dow Transportation index. It made an all-time high in March along with the Industrials, but it is now showing even less strength than the Industrials. Both Dow indices and the NASDAQ are lagging the NYSE, Russell 2000, and S&P 500. Are they leading, or following? This is what will be determined in the next few weeks. Whatever happens to the other indices after the anticipated July correction, if GE, the NASDAQ and the DOW turn down before surpassing their former recovery highs, it will sharply increase the odds that the bull market which began in October 2002 is coming to an end.
The short-term trend in the SPX which began in the middle of May has consisted of a number of small fractal units with each successive one holding above the former low and subsequently making a new high. Friday's high of 1219.55 came very close to a 1219.85 Fibonacci projection, and this suggests that a temporary top has been reached. This is reinforced by the expectation of some short-term cycles bottoming next week. Also, by trading above 1192, the S&P set up a longer term projection zone from 1207 to 1226. Friday's move stopped in the middle of that range. Whether or not the index makes it to the top target depends on how much weakness develops in the next 3 or 4 days.
Options expiration resulted in a record first hour volume and a total daily volume of 2.4 billion shares on Friday. During the previous 3 weeks of advance, the daily volume had only averaged around 1.7 billion shares per day -- a very low number by past standards -- and Friday's high volume day has very negative implications. 1190 is currently the most important short-term support for the SPX. If it is broken, this would trigger Fibonacci projections from 1183 all the way to 1175 before the market attempts to reverse once again.
Another negative which has been ignored by the stock market in the past few days is crude oil's move to new highs. This is not expected to be the beginning of another major up-trend in oil, but it has the potential of going further and keeping prices at high levels for some time. If the stock market's recent strength was the result of unsustainable conditions, i.e. options expiring and short-covering, it may suddenly react to the new high in the price of oil. It has been my experience that, when important cycles wait until the last minute to make their lows, they make up for lost time with a very quick and sharp price decline. This could very be what lies directly ahead.
Gold began a retracement of its recent down trend, and even though the commercial traders are once again increasing their short positions, the rally still appears to be several weeks away from a top.
Coincidentally, after what appears to have been a climactic move caused by sudden weakness in the Euro, the US dollar is undergoing some consolidation which is also likely to last a while.
Charts
The following charts will illustrate some of the points made above.
The first chart is that of the daily chart of the NYSE, one of the strongest indices right now. The sharp up-move this past week could be construed as strength but, as stated above, one wonders at how much of this was attributable to options expiring. Also note that the RSI, at the bottom, is now overbought. You can see that in the past, this has led to a retracement.
The daily chart of the NASDAQ (one of the laggards) should be compared to the NYSE chart above. This index has not been able to overcome its last top or rise above its January/February highs. The RSI is now showing negative divergence with price, indicating that more weakness is likely in the near future. Since the NASDAQ usually leads, this cannot be a good sign.
Particularly worrisome is the third chart which is a weekly chart of the Semiconductor Sector Index. It is far weaker than the NASDAQ of which it is an important component, and it seems to be coming to the end of a 5 wave pattern which normally indicates a trend reversal.
The fourth chart is a daily chart of GE. The stock has been significantly weaker than the market in the past three weeks, and if it breaks through its short term up trend line, this cannot be a good omen for the current market trend, especially if it continues and penetrates is 35 support level.
Finally, the last two are quarterly charts of the Dow Jones Industrials. The first one is in log scale and gives equal weight, percentage-wise, to the upper and lower ranges of the chart and makes the fluctuations of the earlier years more apparent. The second chart is in arithmetic scale and is meant to show more clearly the 46% decline in the Dow from 2000 to 2002.
I have drawn a dashed vertical line every four years to mark the lows of 4-year cycle. Except for 1986 and 1994, when prices went sideways for several months, the bottoming of the 4-year cycle has brought about a fairly extensive price decline with 1974 being the worst. What makes 1974 so special? It was also the low of the 40-year cycle which previously bottomed in 1934 and was the cause of the 1929 bear market. The next low is due in 2014, only 9 years from now.
It is clear that the long-term chart of the Dow Jones is very bearish. First, the up channel which goes back to the 1974 40-year cycle low has been broken. It also shows that the current rally is losing its upside momentum with prices beginning to roll over. Finally, the RSI looks very weak. It has not been able to generate significant upside momentum since the 2002 market bottom, and it has been essentially flat for many months.
Conclusions: From a cyclical point of view, 2000 was the top of the 40-year cycle, and from this point on, until it makes its low in 2014, each 4-year cycle will become progressively weaker both in its up and down phase, with the last one in the larger wave probably bringing about a bear market which could rival 1929, as well as economic havoc.


SUMMARY:
The stock market is entering a critical period from a short as well as long-term perspective. Longer term, important negatives are beginning to surface which, if they continue, will result in the top of the bull market.


