• 867 days Will The ECB Continue To Hike Rates?
  • 867 days Forbes: Aramco Remains Largest Company In The Middle East
  • 869 days Caltech Scientists Succesfully Beam Back Solar Power From Space
  • 1,269 days Could Crypto Overtake Traditional Investment?
  • 1,274 days Americans Still Quitting Jobs At Record Pace
  • 1,276 days FinTech Startups Tapping VC Money for ‘Immigrant Banking’
  • 1,279 days Is The Dollar Too Strong?
  • 1,279 days Big Tech Disappoints Investors on Earnings Calls
  • 1,280 days Fear And Celebration On Twitter as Musk Takes The Reins
  • 1,281 days China Is Quietly Trying To Distance Itself From Russia
  • 1,282 days Tech and Internet Giants’ Earnings In Focus After Netflix’s Stinker
  • 1,286 days Crypto Investors Won Big In 2021
  • 1,286 days The ‘Metaverse’ Economy Could be Worth $13 Trillion By 2030
  • 1,287 days Food Prices Are Skyrocketing As Putin’s War Persists
  • 1,289 days Pentagon Resignations Illustrate Our ‘Commercial’ Defense Dilemma
  • 1,290 days US Banks Shrug off Nearly $15 Billion In Russian Write-Offs
  • 1,293 days Cannabis Stocks in Holding Pattern Despite Positive Momentum
  • 1,294 days Is Musk A Bastion Of Free Speech Or Will His Absolutist Stance Backfire?
  • 1,294 days Two ETFs That Could Hedge Against Extreme Market Volatility
  • 1,296 days Are NFTs About To Take Over Gaming?
What's Behind The Global EV Sales Slowdown?

What's Behind The Global EV Sales Slowdown?

An economic slowdown in many…

How The Ultra-Wealthy Are Using Art To Dodge Taxes

How The Ultra-Wealthy Are Using Art To Dodge Taxes

More freeports open around the…

Is The Bull Market On Its Last Legs?

Is The Bull Market On Its Last Legs?

This aging bull market may…

  1. Home
  2. Markets
  3. Other

USD/JPY: Making New Highs

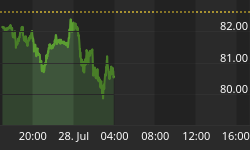
USD/JPY has broken the key resistance at 102.70-102.83. A further medium-term rise towards the resistance at 104.92 (16/01/2014 high) is favoured. Monitor the test of the key resistance at 103.44 (29/01/2014 high). Hourly supports can now be found at 102.61 (intraday low) and 102.24 (intraday low).

A long-term bullish bias is favoured as long as the key support area given by the 200 day moving average (around 100.21) and 99.57 (see also the rising trendline from the 93.79 low (13/06/2013)) holds. A major resistance stands at 110.66 (15/08/2008 high).

We have removed our long strategy given the recent new highs above 102.83.

Daily Technical Report


Read the Report

Back to homepage

Leave a comment

Leave a comment