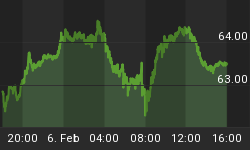
The last month or two has provided a wonderful illustration of why a diversified commodity index is a better investment than an investment in any given commodity. Since mid-February, April Lean Hogs has rallied 23%. Since late January, May Wheat is up 23%. March Coffee is up 80%. Gold is up 9%. But Crude Oil is 6% off its highs. Copper is 12% off its highs (8% since Thursday). April Nat Gas was up 42% from November through late February, but has lost 10% since then.
This is great if you happened to be 100% in Coffee, and bad if you happened to be heavy into copper or RIO or BHP. But this sort of volatility and non-correlation is exactly where much of the return to commodity indices, over the long run, comes from. Later this month, commodity indices will sell coffee and buy copper, systematically buying low and selling high. This phenomenon is worth on average a couple of points of return per year.
Most commentators seem to be focusing on the precipitous decline in copper prices, supposedly because "Doc Copper" is supposed to be a good leading indicator of economic growth. But in this case, the behavior of copper is mostly due to quasi-panic over China's recently flagging growth figures. Although China is not the only consumer of copper (although sometimes you might think so, from the news coverage), prices are set at the margin and if there was an actual recession in China as opposed to a modest slowdown, then this would push copper prices lower.
But that would be terrific for Europe and the U.S., because it would mean cheaper copper for us. Similarly, decreasing Chinese growth would relax some pressure on energy prices, which would also be a boon for the Western world. I think people forget that one of the key reasons the "Asian Contagion" from the 1997 Asian Financial Crisis never happened (U.S. growth "bottomed" at 4.1% in mid-1998 - a level it hasn't reached since 2004) was not because of Federal Reserve action (from March 1997 until August 1998, the Fed Funds target never budged from 5.5%) but because commodity prices plunged from 1997 into 1999. The DJ-UBS index fell from around 128 one month before the Thai baht collapsed to 75 in the first quarter of 1999 (see chart, source Bloomberg).

Even worse (or better, depending on your perspective) was the decline in energy. Crude oil dropped 55%, from the $25 area at the beginning of 1997 to $11 by late 1998. That remains the lowest real price of U.S. oil recorded since 1946 (see chart, source Enduring Investments using data from Dow Jones and the Bureau of Labor Statistics).

It may be impolitic to say so, but probably the single best thing that could happen to U.S. growth would be for Chinese growth to slow, pushing the price of important commodity prices lower. As a nation, we consume far more commodities than we produce, so lower input prices is a net positive.
However, I suspect this is much ado about nothing. Chinese growth, even if it slows, is likely to remain plenty hot enough to keep commodity prices from falling very much, even in real terms. Real commodity prices have been falling steadily since 2011 (which is why all of the talk about the "end of the commodity supercycle" a year ago was so humorous) until early this year, even while the amount of currency in circulation has steadily increased. It certainly seems to me as if we have priced commodities fairly conservatively, and they can probably withstand a growth slowdown in China as long as the country doesn't enter a bona fide crisis.
You can follow me @inflation_guy!
Enduring Investments is a registered investment adviser that specializes in solving inflation-related problems. Fill out the contact form at http://www.EnduringInvestments.com/contact and we will send you our latest Quarterly Inflation Outlook. And if you make sure to put your physical mailing address in the "comment" section of the contact form, we will also send you a copy of Michael Ashton's book "Maestro, My Ass!"


