


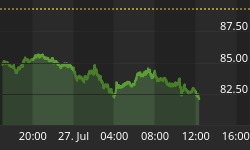


Charts created using Omega TradeStation 2000i. Chart data supplied by Dial Data
The chart of the FTSE/XINHUA China 25 Index (XIN) is something else that gives us that sinking feeling. If this chart is combined with a chart of copper then one might get a double sinking feeling. The S&P 500 may be near all-time highs but underneath not all is well.
China is the most populous country in the world. It is now the world's second largest economy and there are many that expect China to become the world's largest economy surpassing the US by 2030. China has been recording 8-10% growth rates almost continually for years. Many have felt that could not last and eventually the booming Chinese economy would not only stall but also crash.
Maybe it was always in the charts. The XIN unlike the S&P 500 and other indices in the US and Europe only regained barely over 50% of its 2007-2008 financial crash. Today the XIN is still down 50% from its 2007 highs. Now it appears it could fall even more.
The XIN appears to be forming a possible descending triangle, which is bearish. The Shanghai Index has a similar chart and the descending triangle pattern is potentially more pronounced. If the descending triangle pattern is correct then the XIN could fall to potential objectives down to 5,700 once it breaks under 14,000. Argumentively one could say this is a possible symmetrical triangle. Symmetrical triangles can be either a consolidation pattern or a topping pattern. The potential objective zone is the same if the XIN breaks under 14,000. The only thing that would change this is a breakout to the upside most likely above 18,000. The weakness of the chart is not suggesting that is about to happen.
The Shanghai Index is shown below. Unfortunately, the chart does not go back far enough to show off the descending triangle pattern. But a series of lower highs has been made with a relatively flat bottom. The last major high was in November 2010 for the XIN but the Shanghai Index made its last major high in 2009. The potential objective for the Shanghai Index is a decline to 500 once it breaks under 1,900. This is not a pretty chart.

![]() Larger Image - Source: www.stockcharts.com
Larger Image - Source: www.stockcharts.com
So what is driving all of this? It is not my intention here to get into what might ail China. But there are signs of a slowing economy. Exports have slowed. There are problems in the real estate market, the banking sector and in the shadow banking market. The PBOC is trying to fight this by lowering interest rates and injecting monetary stimulus in the market. But the question is will it be enough. Then China announced they were letting Shanghai Chaori Solar go bankrupt. This came as quite a surprise to the market as it is the first time a large Chinese company was allowed to go bankrupt.
China's economy has slowed to at least 7% and possibly lower. That doesn't sound like a lot but it is 30% below peak growth of 10%. If this were the US, growth would slow from 2.8% to 2%. So in economic terms that is quite a bit. Chinese money markets are showing signs of stress and recently China tried to lower the trading band for the Yuan. This caused considerable consternation in the market.
But one should pay attention to the collapse of Shanghai Chaori. This triggered a drop in the price of copper. Copper prices are now below $3. What one has to worry about is an unwind of the "copper carry trade". China imported a lot of copper. The copper was stockpiled. It has grown sharply over the past few months. A copper carry trade works as follows. The copper stockpiles are collateralized. It is estimated that some 60% of the stockpiles have been collateralized. The funds are then used to invest in rising markets such as the US stock market. An unwinding of this trade could cause a stock market collapse in the US as the funds are withdrawn. NYSE margin debt hit a record $451 billion at the last report just a week ago. A falling US stock market would also see the unravelling of the record margin debt.

![]() Larger Image - Source: www.stockcharts.com
Larger Image - Source: www.stockcharts.com
It is one thing that the "copper carry trade" might unwind but it is another if one adds in other carry trades. There has also been a large "yen carry trade". It works much the same way. The Yen has been very weak. Borrowing in Yen is cheap. With cheap borrowing costs and a weak Yen one sells the borrowed for say US$ and invest the proceeds in say the US stock market where the returns are higher. Investments might also be made in Russian bonds as another example. If Russia defaults unexpectedly because of sanctions holders of those bonds would have a major problem.
The descending triangle on copper suggests that copper prices could fall down to objectives just under $2. That is quite a drop. The drop in copper prices this past week coincided with the collapse of Shanghai Chaori Solar. The company was a prime user of copper.
The Chinese stock market appears to be tipping over but it has not yet broken down. Copper prices collapsed and could be headed considerably lower. But gold did the opposite. Gold broke out over $1,350 on March 12, 2014. This could be significant. The potential objective for gold is $1,650. Gold is potentially sensing a potential financial crisis. Then there is the referendum in Crimea this weekend. All of this continues to give me a sinking feeling. Beware the Ides of March.


