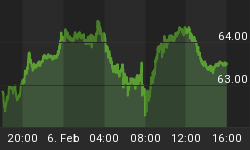
The gold price continued the previous week's fall into Monday, which was the end of the first quarter of 2014. Since then having reached a low point of $1278 in New York trading, gold rallied to a high of $1294 on Tuesday before weakening on Thursday morning.
The biggest influence was not stories and announcements, but the market-makers' attempts to reduce their exposure by the quarter-end. This can be clearly seen in the chart of gold and open interest below.

The rise on open interest peaked with the gold price three weeks ago. This indicates that buying interest since early February was being accommodated by an increase in market-makers' short positions, instead of being met by genuine sellers, hardly a surprise. Shorts were also closing their positions by transferring them to the market-makers, aka bullion banks. And when there was no follow-through as a result of the Crimean situation, these market makers had to reduce their commitments ahead of their quarter-end report date, 31st March.
The result is open interest has contracted from a rich 427,774 contracts on 17th March to 363,451 contracts on 1st April, the lowest open interest since May 2009, and this week Comex volume has fallen from over 335,523 contracts a week last Thursday to a low of 106,729 yesterday. This tells us that interest in Comex gold is now as low as it is likely to get and further attempts by the market-makers to close short positions are unlikely to succeed.
Silver provides an interesting contrast, with open interest remaining stubbornly high and rising.

The test for silver will come when traders decide whether or not to roll their May contract positions. Until then it appears that rather than be shaken out by falling prices the bulls have held on, increasing their positions on falling prices.
Underlying demand for physical gold remains strong. China so far this year has delivered nearly 560 tonnes to its public, and I believe is building vaulted gold stocks for gold account customers at a similar rate. I publish an analysis of China's gold buying this weekend, which I urge GoldMoney customers to read. The conclusion is that far larger quantities of gold are flowing from western vaults to China and Asia than I originally thought. The implication is that the suppliers of this physical, which can only be western central banks, are on course to run out of leasable gold, unless the price is allowed to rise sufficiently to reduce this demand.
Next week
Later today the markets expect US non-farm payrolls to come in at about 200,000 with an unemployment rate falling from 6.7% to 6.6%. This is the first set of figures unaffected by adverse weather, so is anticipated with interest.
It will be a quiet week for announcements.
Monday. Japan: Leading Indicator, Current Account. US: Consumer Credit.
Tuesday. UK: Industrial Production, Manufacturing Production. Japan: MPC Overnight Rate, Economy Watchers Survey.
Wednesday. Japan: BOJ Monthly report, Bank Lending Data, Key Machinery Orders. UK: Trade balance. US: Wholesale Inventories.
Thursday. UK: BoE MPC Base Rate. US: Import Price Index, Initial Claims, Budget. Japan: BoJ Minutes, M2 Money Supply.
Friday. US: PPI, University of Michigan Sentiment Index.


