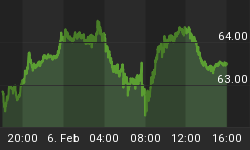
The SPX fell into a bounce zone in yesterday morning's session and found support around last month's lows. This begs the question for both traders attempting to paint the edges or investors looking to hedge their portfolios - will it hold, how strong of a bounce to expect and for how long? Taking into account our comparative sensibilities, a follow-up query might provide greater perspective. If the equity markets have indeed exhausted, what kind of top was it? Short-term, intermediate, long-term - cyclical, secular?
For those that have followed our logic in recent weeks these are rhetorical questions. However, it should be understood that our assumption of a top with just a few weeks (much less with the SPX) of daylight between those highs, is that it is a market posture and not an ideology. Keep in mind that in our experience the bear wool goes on much easier than comes off. Considering the SPX's relative strength and proximity to its high water mark, versus its more volatile and higher beta cousins, Mr. Russell and Ms. Nasdaq - we should know soon if it's just whimsical fashion or trend setting.
Our suspicions, based on our peripheral studies is that it was an intermediate to long-term top and of the cyclical variety. And while the nomenclature likely just muddles the water with regards to future expectations, the takeaway for us is that we would handicap a higher probability that the SPX revalues expectations swifter - then churns indefinitely, rather than a slow motion and eroding correction that rewards perennial bearish leanings (i.e 2000 & 2007).
These expectations are based on a variety of factors, but in general fall at the foot of the broader interest rate cycle and monetary policy. If past is prologue - both recent and historical, the SPX takes an expedited path lower as the Fed steps away, rather than the long and winding road characteristic of its two previous long-term tops. Look no further than the end of QE1 and QE2 for examples of this market dynamic that some might call obvious to the point of spurious. All cynicism aside, we view causation between the market and the Fed as blurred, thick and gray between structural - psychological and back again. Hindsight 20/20, the 1940's are our closest parallel. A time when the Fed was active, obvious and some might say rather magnanimous to the markets. And while a price was certainly paid when they stepped away, by comparison to its then more contemporary anxieties of the Great Depression - a discounted expense.
Circling back to the initial question - we do think the equity markets will firm over the next several sessions, but expect it will be shallow and brief. In essence - a dead cat bounce. Bonds and the yen look poised to break higher and the Nikkei looks ready to shoot the retracement hole below 14,000.


