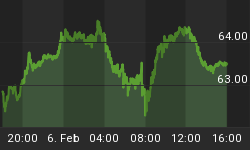
NDX is approaching the February low.
As discussed in weekly update on April 6, this area is a twofold critical since it coincides with the 10 mma.
If this support does not hold we can see that, in the monthly time frame, there is not a clear obstacle that could prevent a drop towards the next major support zone located at the trend line support in force since the 2009 lows and the 0.5 retracement of the up leg from the November 2012 higher low. We are talking about a 10% decline.
Undoubtedly such an outcome would seriously jeopardize the SPX short-term bullish scenario of a potential pending last up leg to a new ATH, which would conclude with a Double Zig Zag or a Triple Zig Zag the 5 years advance from the March 2009 low.
In the weekly chart we can see that above the "major" trend line from the 2009 lows we have a potential support zone located in the range 3280 - 3250 (Trend line from the November 2012 low and the 0.382 retracement of the advance from the November 2012 low to the March high). This retracement could still be considered a pullback within the longer time frame pattern, which probably would not endanger the intermediate up-trend, notwithstanding this outcome would suggest further weakness for the equity market as a whole.
It is a bit troublesome though that even if the February low holds, in the following rebound if bulls do not reclaim the March 14 low there is a latent risk of that a failed rally could develop the right shoulder of a H&S. This theoretical H&S would have a target at the Trend Line in force since the 2009 lows.
Another bearish issue is the loss of the 27 wma.
It seems probable that barring a monster rally the next rebound (until proven otherwise) will establish a lower high.
For the shorter-time frame last week Inverted Hammer is suggesting selling exhaustion hence this week odds favour a bottoming attempt.
In the daily chart we can see that despite the sharp selloff from the March 11 high the pattern is corrective. So far we have a 7-wave overlapping structure, however it is a fallacy to give for granted that this corrective pattern cannot grow in size (Maybe by establishing the wave A of a larger Zig Zag down).
Hence we cannot know beforehand if price will establish a new swing bottom (In which case bulls will have to reclaim the 50 dma) or a tradable bottom that will open the door to a large rebound that eventually will fail by establishing a lower high.
In the chart we have 4 clear price levels where an oversold rebound can fail and at the same time we can see that as long as the 50 dma is not reclaimed the risk remain to the downside.
For the immediate time Friday's doji following Thursday's sharp selloff is suggesting probable selling exhaustion hence the odds favour a rebound attempt.
Shutting down the computers. I will be back on April 21.


