


Bottom line: Sell Japan, I think both markets still need at least one more leg lower to complete a corrective WXY decline from their respective peaks.
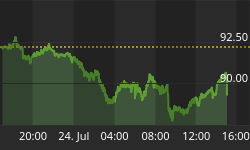
USDJPY

If you take a non-biased approach and simply counted the decline as you see it, you can clearly see there are 7 swings from 105.34 - 100.74, so by definition it's a corrective decline, or part of a larger more complex pattern. The move from 100.74 - 104.12 is also a corrective set of waves and thus labeled a corrective bounce.
This would still imply that USDJPY should see a move back under 100.74 to complete a potential WXY correction from 105.34, ideally targeting towards 99.50.
The market is bearish under 104.12; whilst it remains under that area we should see at least a new swing low under 100.74. Resistance is between 102.80 - 103.50 but it's subject to the current bounce.
NIK-225

The decline from 16452 - 13943 appears to be a 7 swing move, so by definition it's a corrective decline or at least part of a larger more complex pattern.
The move from 13943 - 15236 is again a corrective series of waves; if you take a closer look you will notice the large divergence between the 2 markets, a sure sign of an impending reversal.

When we see this inter-market divergence it's generally seen at reversal points, in this case it was a peak for both markets, but we can also see that sort of divergence at major lows as well, 2 markets that follow in each other's footsteps suddenly diverge from one another.
Whilst the NIK-225 is under 15236 we should see at least a new low towards 13500 possibly towards 13000 depending on the next decline.
Based upon the current wave structure it still appears to be missing at least another leg lower in both markets, so the moral of the story is to look to sell Japan for a move lower.
USDJPY is bearish below 104.12
NIK-225 is bearish below 15236
NIK-225 = NIK-225 futures not the cash market
It's now closing in on my initial target I had targeted back in Dec 2013, way before this current decline, such is the power of Elliott Wave used in the right hands.

If it remains as a corrective looking decline, then it could potentially be a large 4th wave, which would imply new yearly highs to come before the trend is finished from the 2009 lows.

Unit next time,
Have a profitable week ahead.


