• 315 days Will The ECB Continue To Hike Rates?
  • 315 days Forbes: Aramco Remains Largest Company In The Middle East
  • 317 days Caltech Scientists Succesfully Beam Back Solar Power From Space
  • 717 days Could Crypto Overtake Traditional Investment?
  • 721 days Americans Still Quitting Jobs At Record Pace
  • 723 days FinTech Startups Tapping VC Money for ‘Immigrant Banking’
  • 726 days Is The Dollar Too Strong?
  • 727 days Big Tech Disappoints Investors on Earnings Calls
  • 728 days Fear And Celebration On Twitter as Musk Takes The Reins
  • 729 days China Is Quietly Trying To Distance Itself From Russia
  • 730 days Tech and Internet Giants’ Earnings In Focus After Netflix’s Stinker
  • 733 days Crypto Investors Won Big In 2021
  • 734 days The ‘Metaverse’ Economy Could be Worth $13 Trillion By 2030
  • 735 days Food Prices Are Skyrocketing As Putin’s War Persists
  • 737 days Pentagon Resignations Illustrate Our ‘Commercial’ Defense Dilemma
  • 737 days US Banks Shrug off Nearly $15 Billion In Russian Write-Offs
  • 740 days Cannabis Stocks in Holding Pattern Despite Positive Momentum
  • 741 days Is Musk A Bastion Of Free Speech Or Will His Absolutist Stance Backfire?
  • 741 days Two ETFs That Could Hedge Against Extreme Market Volatility
  • 743 days Are NFTs About To Take Over Gaming?
Strong U.S. Dollar Weighs On Blue Chip Earnings

Strong U.S. Dollar Weighs On Blue Chip Earnings

Earnings season is well underway,…

Market Sentiment At Its Lowest In 10 Months

Market Sentiment At Its Lowest In 10 Months

Stocks sold off last week…

readtheticker

readtheticker

readtheticker

We are financial market enthusiasts using methods expressed by the Gann, Hurst and Wyckoff with a few of our own proprietary tools. Readtheticker.com provides online…

Contact Author

  1. Home
  2. Markets
  3. Other

Bank Rally Near End

Bank Rally getting tired

The bad boys of the 2008 financial crisis have come back strong over the last 5 years, it most cases bank stocks have recovered half of there loses. But like all energy, it does exhaust itself.

The stock market has had a great 5 year run from 2009 lows, many many charts are at upper channel lines and major resistance levels. Below is just another example.

Controlled distribution has been going on in the markets, however not so controlled in the tech stocks (FB,TSLA,AMZN,PCLN,NFLX). As always the market needs a catalyst to send it lower. In a market that has much to do with central banks, a negative catalyst would be rising interest rates that occurs due to market forces and not central bank wishes. A hint, keep an eye on Japanese bonds in the next month or two.
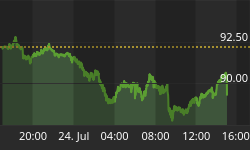
NASDAQ Bank Weekly Chart

And the SPDR XLF...

XLF Financials Select Sector Weekly Chart

NOTE: readtheticker.com does allow users to load objects and text on charts, however some annotations are by a free third party image tool named Paint.net

Investing Quote...

"TIME is the most important factor in determining market movements and by studying the past records of the averages or individual stocks you will be able to prove for yourself that history does repeat and that by knowing the past you can tell the future. There is a definite relation between TIME and PRICE. Now, by a study of the TIME PERIODS and TIME CYCLES you will learn why tops and bottoms are found at certain times and why Resistance Levels are so strong at certain times and bottoms and tops hold around them. The most money is made when fast moves and extreme fluctuations occur at the end of major cycles." ~ William D Gann

"The first rule is not to lose. The second rule is not to forget the first rule." ~ Warren Buffett


Back to homepage

Leave a comment

Leave a comment